- Lesson 8: Population Health Management
- Case Study: PopHealth
- Case Study: Quality Health First Introduction
- Case Study: Wellcentive Introduction
- Public Health Overview
- Overview
- Supplementary materials
Lesson 8: Population Health Management
* primary focus of healthcare: traditional “one patient at a time” care paradigm,
- managing public health problems across the population is also important.
- Informatics has a key and essential role in aggregating and reporting data at population level
Case Study: PopHealth
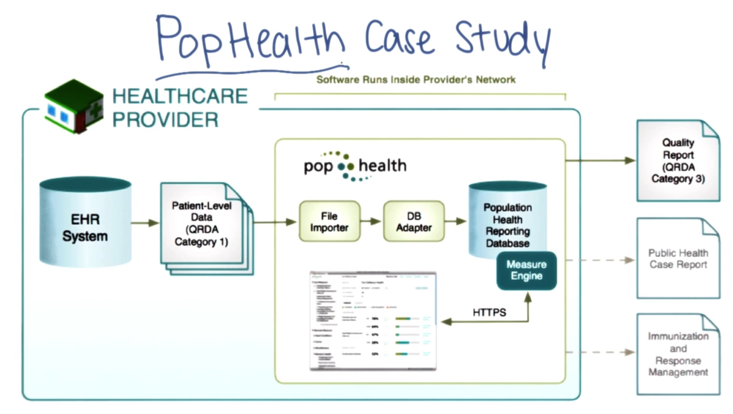
PopHealth:
- open source Quality Measure Reference Implementation supported by ONC.
- queries are run against data in each provider’s EHR (data is in providers’ control).
- The results are statistics at one of three levels of detail, called QRDA.
- popHealth is designed to deal with the reality in most places with no HIE in place
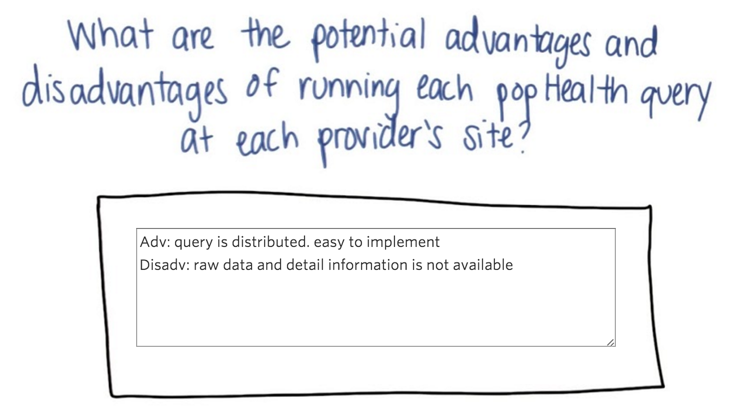
Answer to quiz 1: adv: 1) provider might be more likely to participate since they have control over the data. 2) security is simplified. Disadv: 1)have to deal with each EMR; 2) changes in EMR might cause problems.
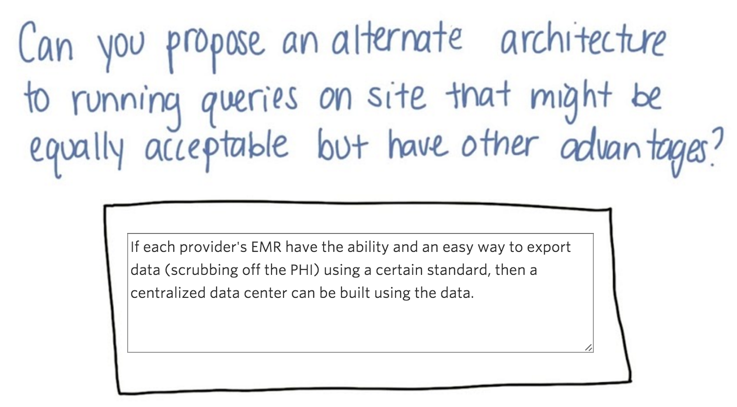
Answer to quiz 2: Centralized “data lockers”. Providers will still have control to the data and queries to respond while keep the data formatting problems to a low level.
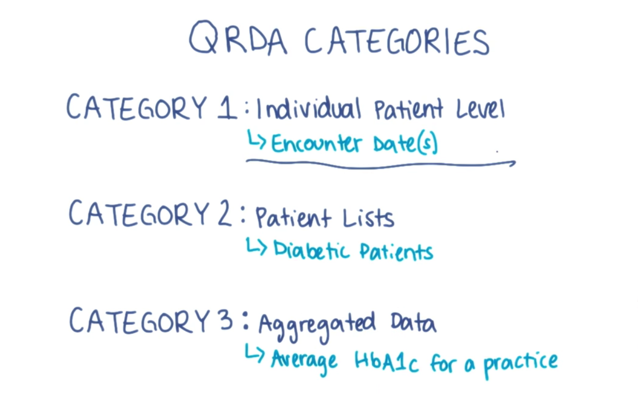
- QRDA is the standard vehicle for reporting the results of population or public health queries
- QRDA = Quality Reporting Document Architecture, which is in a CDA-compliant format
- Reported statistics can be classified into three levels of QRDA categories
- Three level:
- individual patient level,
- lists of patients
- data aggregated over the entire practice or reporting entity.
Note: PopHealth supports reporting in three different levels
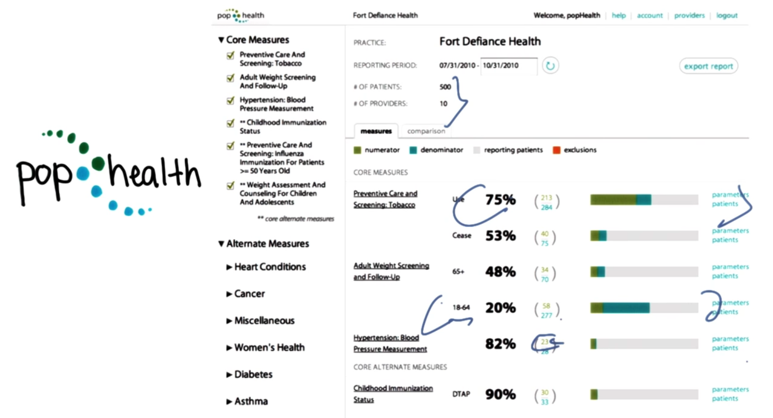
- example: 500 patients from a 10-provider practice (in which individual physicians could be using different EMRs).
- smoking screening is good but weight screening is not so well.
- the need to identify the right group of patients for each metric.
- the numerator — typically the number of patients whose care met criteria
- the denominator — the applicable target patient group for the metric
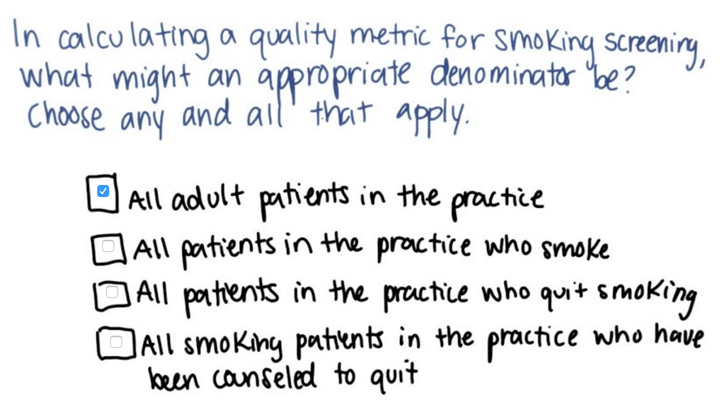
- applicable target patient group should include any individuals at risk
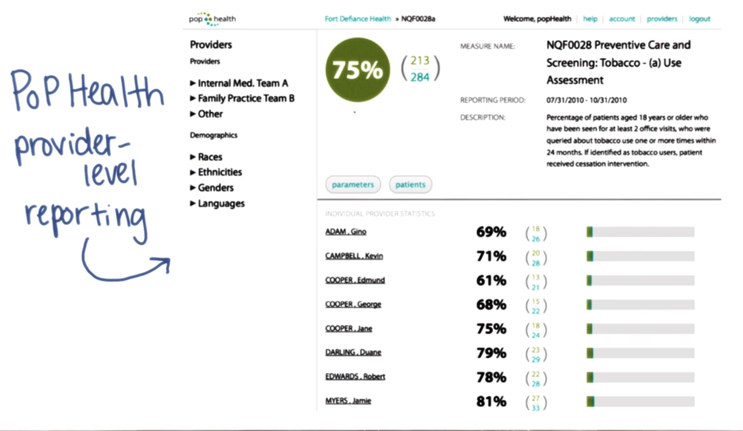
- provider level reporting provide details about all providers
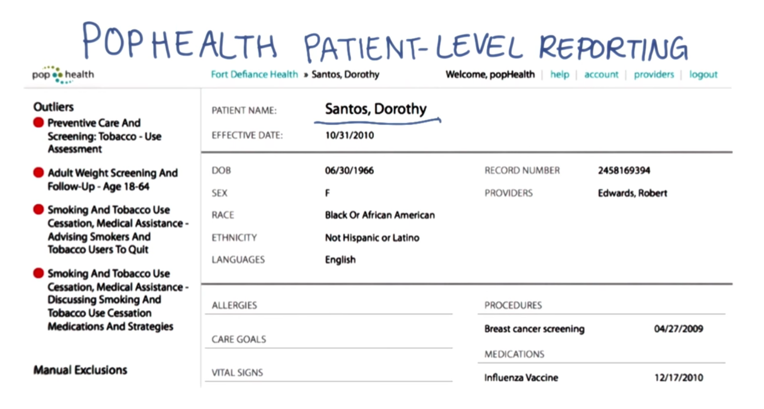
- patient level reporting can provide patient status at a glance
- Care outside of guidelines is flagged here in red.
Case Study: Quality Health First Introduction
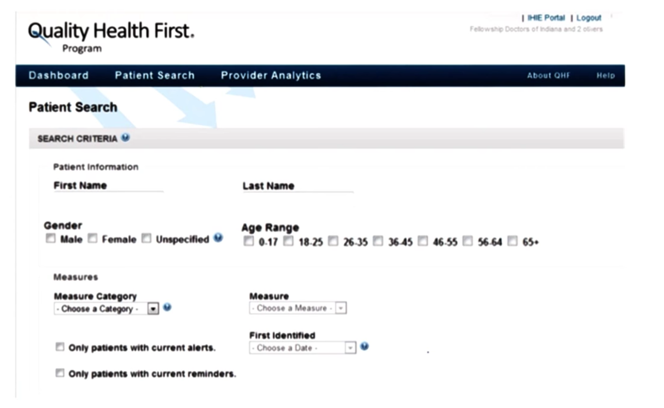
IHIE
- Quality Health First supports more sophisticated searches using a simpler data model than IHIE on A wide variety of patient subsets
Recall that in Lesson 2 we learned process and outcomes measures. The process measure is whether it is done periodically according to guidelines and it’s actual value is a measure of the outcome of care.
- quality reporting to add transparency to healthcare through public reporting of quality metrics.
- In Indiana, many providers voluntarily report this data at a practice level.
Quality Health First Public Measures
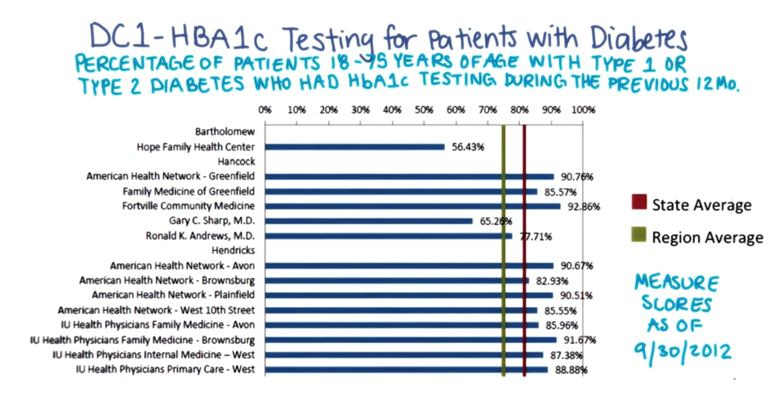
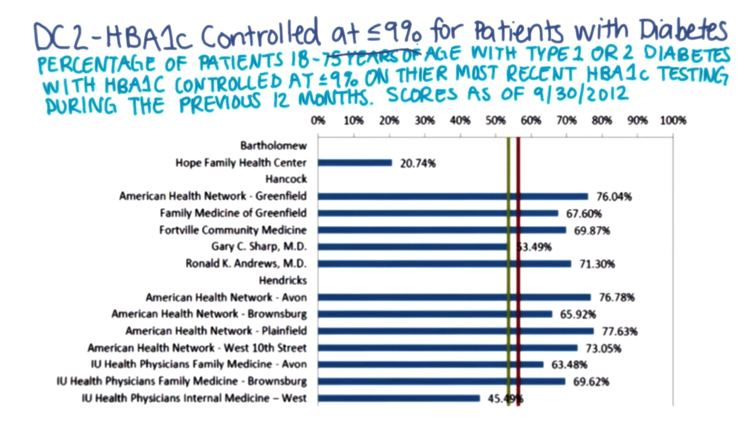
Above are examples of provider level HbA1C process metric and QHF outcome metric. State average = red line; regional average = green line.
Here’s a similar report based on HbA1C that shows seven practices are below state average (red line) and five are below their regional average (green line)
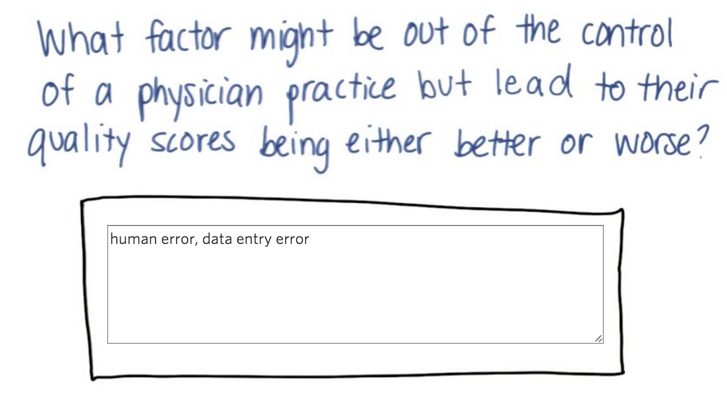
Answer to Quiz 4: Mix of patient based on their social, economic or demographic factors.
Case Study: Wellcentive Introduction
- outcomes based contracting by insurance companies, Medicare and even major employers, commercial companies now provide the population health management tools. Wellcentive is one of them. (based in Atlanta)
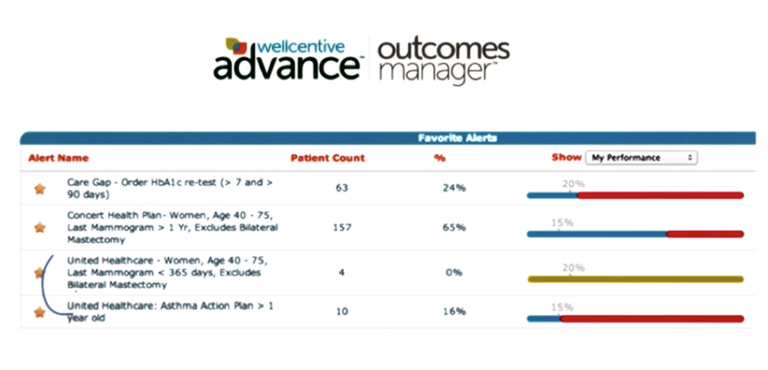
- A report of overall performance for a list of practice-defined alerts
- illustrates the need to managed metrics specified in these contracts.
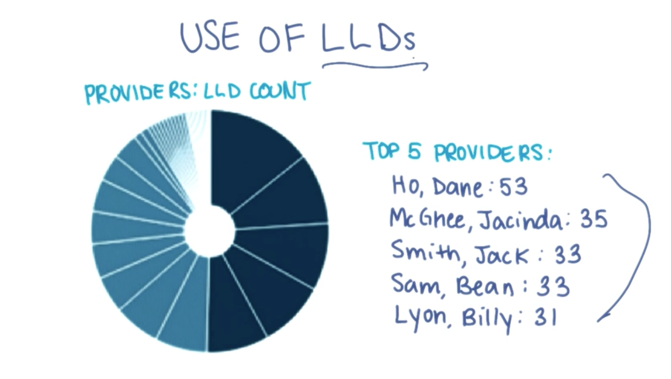
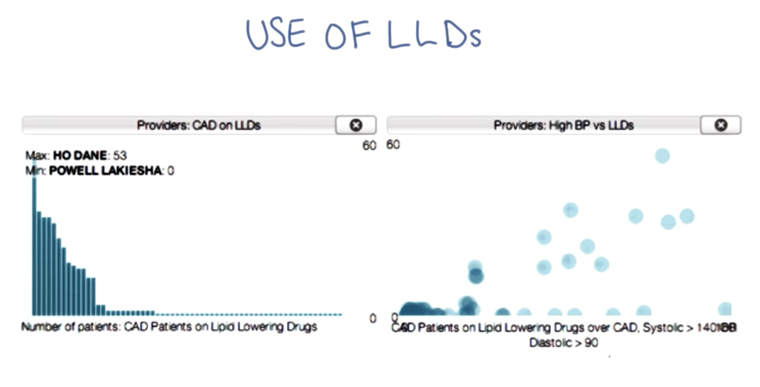
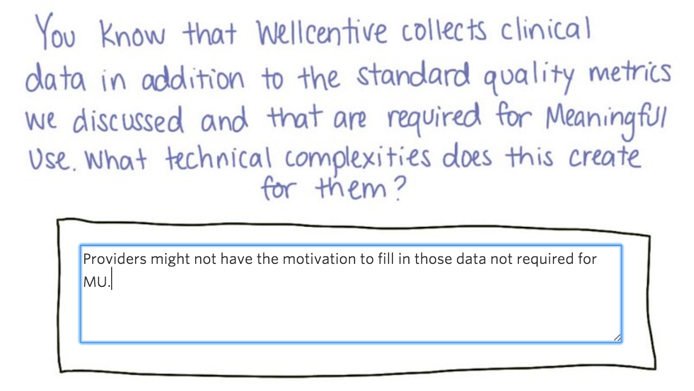
1) security and trust issues; 2) standardize the clinical data.
Interview with Kirk Elder

Q1: Founding story of Wellcentive, Inc.
A: Two brother in law, one is generating quality measurements using excel sheets, the other is a software engineer who knows how to help with this process both sees a market. They found the company to provide software which helps providers generate quality reports.
Q2. How many data are you collecting and processing?
A: we have about 1000 practices, 8000 physicians are using the service, 25,000 interfaces to collect data from. Process 200 million clinical data points per month. have sent 175 million transactions to payers and resulted in payment based on clinical quality.
Q3. How do you do it?
A: be aggressive on data collection from customer. Create interface to parse, process and interpret the data and put them into structured format so it can be used by the application.
Q4. How do you normalize and standardize data from multiple sources.
A: We do this in a “purpose driven” way: ask customers what should be in the quality report for them to get paid by the payers and only pick out the related data points from the data we get. We then create custom dictionaries of the quality measures and mappings between custom dictionaries to national standards.
Q5. How do you address security issues.
A: HIPPA risk assessment (pass all the checklist) on the application and HIPPA education to employees is required.
Q6. How do the system handle patients who have to see multiple providers?
A: Practice entities are trying to solve the problem internally via DIRECT and HIEs.
Q7. What do you think the role of direct in the complex practice, doctors and patient relationship?
A: We are MU certified so we support standards and protocols such as Direct and CCDA. But we deal with EHR most of the time. We see DIRECT as a technology to get clinical information from outside the practice.
Q8. What we are going in terms of population health can quality measurement.
A: Patient can seek service from multiple places and there data will come from different providers and systems. To access the total quality, one has to gather and aggregate all the data. Base on these, we have to figure out who is responsible for the quality actions and should be paid for the action taken.
FTC ask provider organization only to contract with payers when they are clinically integrated, which is difficult. workflow and health systems need to change their internal structures over time.
Once physician engagement is achieved, then we can see patient engagement.
Public Health Overview
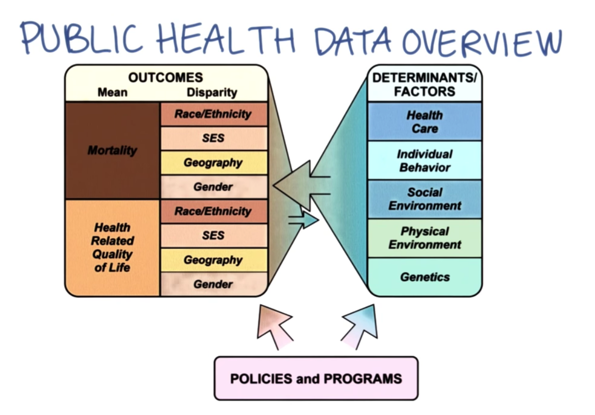
- From an informatics perspective, many aspects of public health are similar to population health:
- data is aggregated and reported.
- However, public health takes a broad view
- uses disparate data sources for the factors determining health and disease.
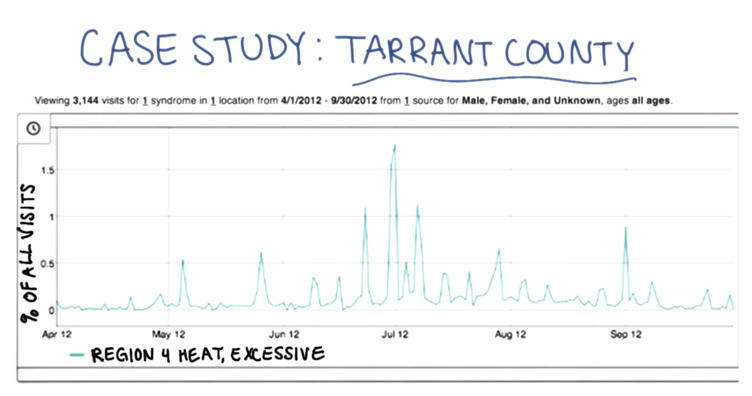
- Syndromic surveillance, monitoring for disease outbreaks.
Overview
- Data can be aggregated across EHRs to manage entire patient populations against defined quality objectives.
- it can be used to support and enhance critical public health services such as disease surveillance.
Supplementary materials
Key Concepts/Vocabulary
● HQMF ● QRDA
Links
- Patient-Centered Primary Care Collaborative publication
- The Query Health Initiative
- Guide to QRDA
- Quality Health First’s public reporting site
- Improving Population Health blog
Videos
- Biosense 2.0 approach
- A more detailed look at the role that syndromic surveillance, the goal of Biosense 2.0, can play
- Dr. Taha Kass Hout describes the Biosense 2.0
Graphics
- popHealth Architecture
- popHealth practice-level report
- popHealth provider-level report
- popHealth patient-level report
2015-10-12 初稿 至quiz 5
2015-10-13 完成