- 01 - Overview
- 02 - A closer look at KNN solutions
- 03 - What Happens as K Varies Quiz
- 04 - What Happens as D Varies Quiz
- 05 - Metric 1: RMS Error
- 06 - In Sample vs out of sample
- 07 - Quiz: Which is worse
- 08 - Cross-validation
- 09- Roll forward cross-validation
- 10 - Metric 2 correlation
- 11 - Correlation and RMS error
- 12 - Overfitting
- 13 - Overfitting Quiz
- 14 - A Few Other Considerations Quiz
01 - Overview

In this lesson, we’ll learn methods for assessing those algorithms.
Time: 00:00:25
02 - A closer look at KNN solutions
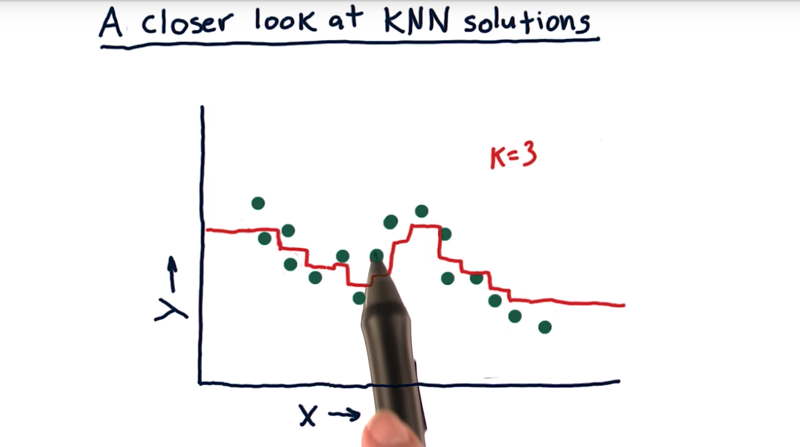
- If we query with X values using 3-NN, for example, as the X moves along the X-axis, the members of the KNN change, thus the resulted Y line (in red) will have small jumps.
- but the beginning and the end of the data, there are parts of the lines are flat (query gives the same value).
- Good thing: it’s not overfitting the data.
- Negative aspect: the model is not able to extrapolate when data is not available.
Time: 00:01:59
03 - What Happens as K Varies Quiz
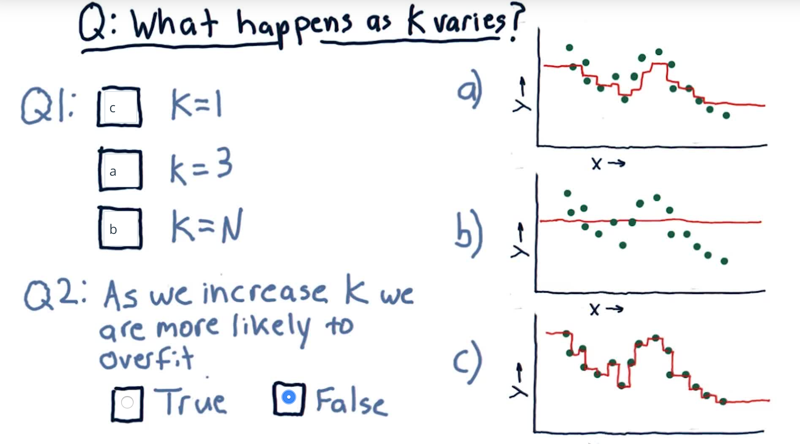
what happens to the model when we change the value of k?
- maching K and graph and anwner when is KNN are more likely to overfit.
So we’ve got three k nearest neighbor models here.
-
overfitting is: An overfit model strives really hard to match the dataset exactly.
- When k=N, the model will be the mean of all the data.
- When K=1 the model is going to tag each point exactly, because, when we’re at that data point, we’ll have exactly that value. This overfits.
- K=3, is our example above.
Time: 00:01:07
04 - What Happens as D Varies Quiz
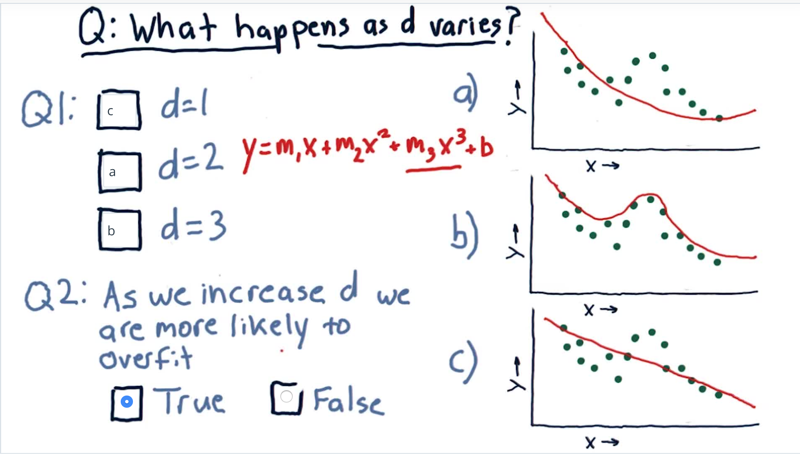
Given a polynomial model of degree d.
- what happens to the model when we change the value of d?
- True or false, as we increase d we are more likely to overfit.
Answer: 1) d=1, a linear model. (C) 2) d=2, a parabola. 3)
- Now as you notice, as we increase from order one to order two to order three, we’re gradually getting closer and closer to tagging the actual data. So we get to this question, as we increase d we are more likely to overfit.
- Note: parametric models can extrapolate in the direction the data seem to be going.
Time: 00:01:37
05 - Metric 1: RMS Error
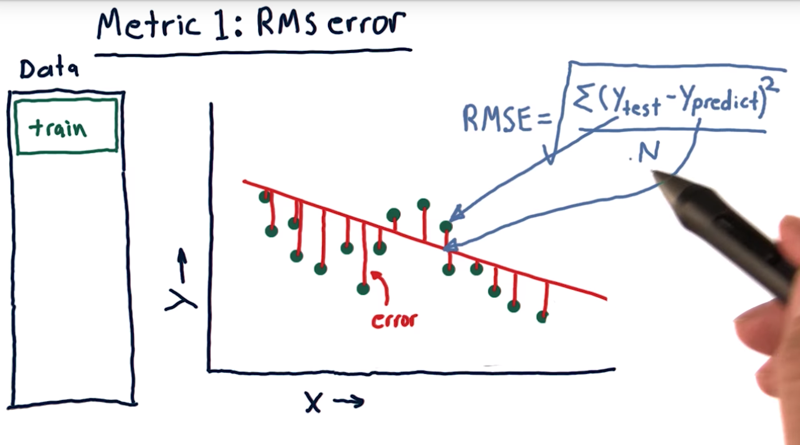
- an error is the difference between the real data and estimated data.
- A standard way to measure error is called RMS error.
RMS = sqrt((Y_real - Y_predict)<sup>2</sup> / N)- RMS is a great representation of mean of error, but it emphasize the large error more.
Time: 00:01:32
06 - In Sample vs out of sample
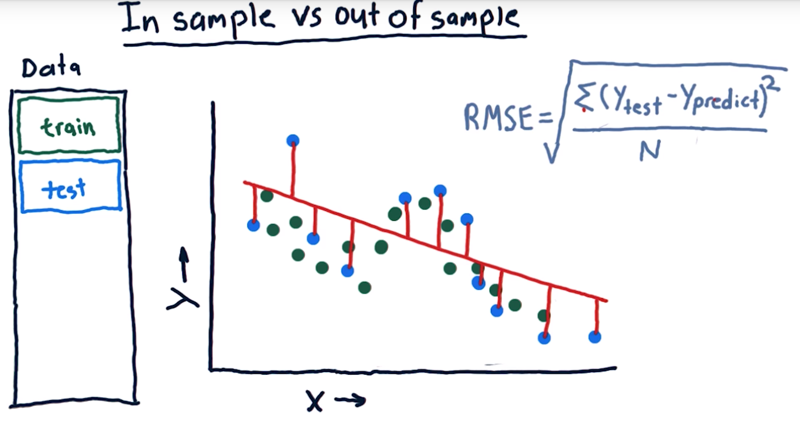
- The error of this linear model against our original training data (Green dots) is important.
- But the more important measure is the error out of sample.
- out of sample means training on our training set, but testing on a separate testing set of data.
Time: 00:00:56
07 - Quiz: Which is worse
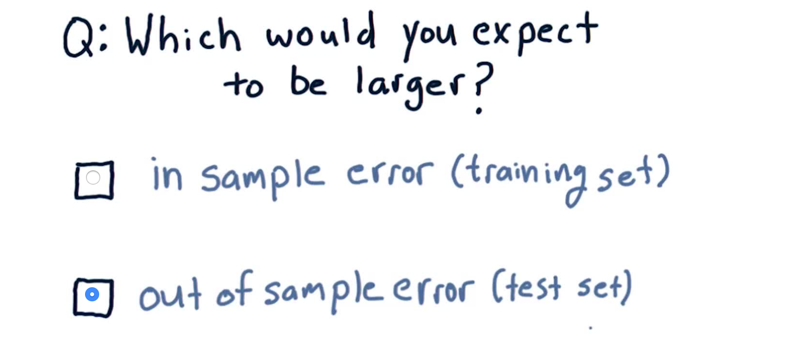
Which sort of error would you expect to be larger?
- In sample error, in which we measure the accuracy of our model against the set it was trained on?
- Or out of sample error, where we measure the error of the model against a new test set that it hasn’t seen before?
The answer is: out of sample error is expected to be worse
Time: 00:00:07
08 - Cross-validation
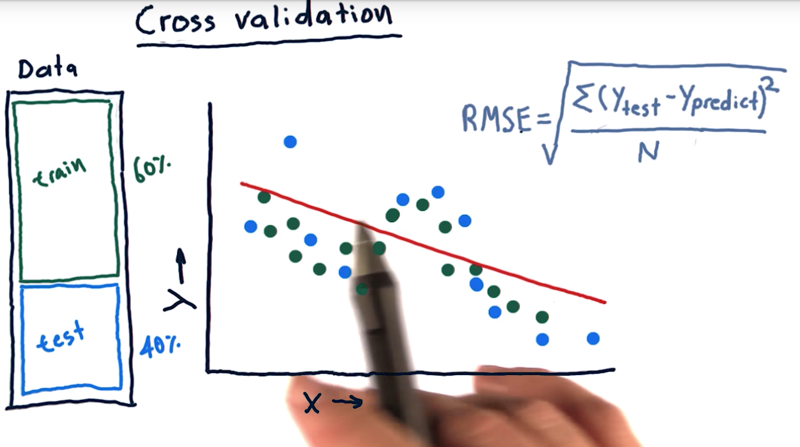
- Cross-validation: evaluating a learning algorithm, they split their data into a training chunk (60%), and a testing chunk(40%).
- one trial = train once and test once. (measure out of sample root means square error to assess your algorithm).
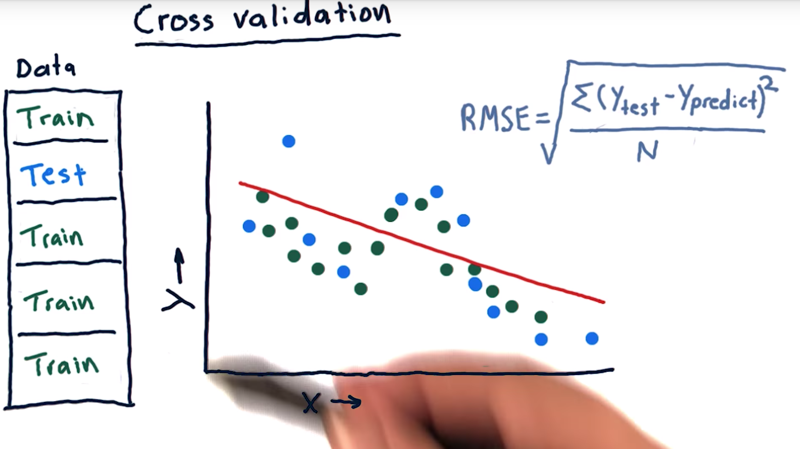
- One way to analyze algorithm with limited data: slicing the data up and running more trials.
- slice our data into five different chunks, run five trials with one of the chunks as testing data and the rest 4 as training data.
Time: 00:01:09
09- Roll forward cross-validation
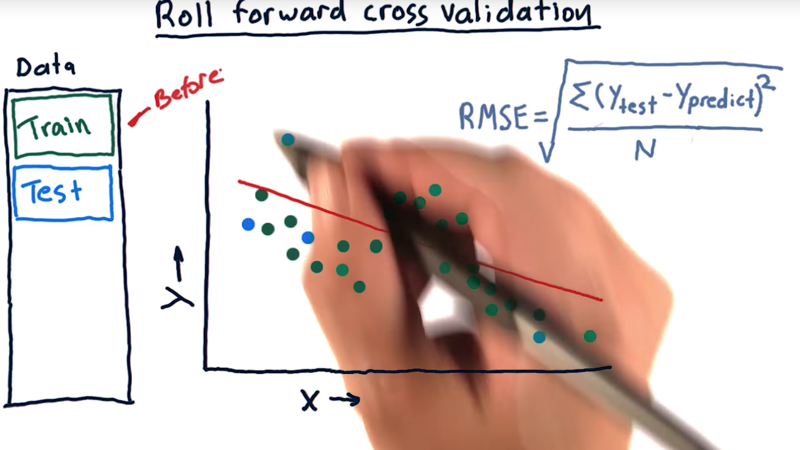
- The typical usage of Cross validation doesn’t fit financial data applications well because it can permit peeking into the future when the training data is after the test data. we need to avoid “peeking into the future “.
- Roll forward cross-validation is a way of doing it. That means our training data is always before our testing data.
Time: 00:00:47
10 - Metric 2 correlation
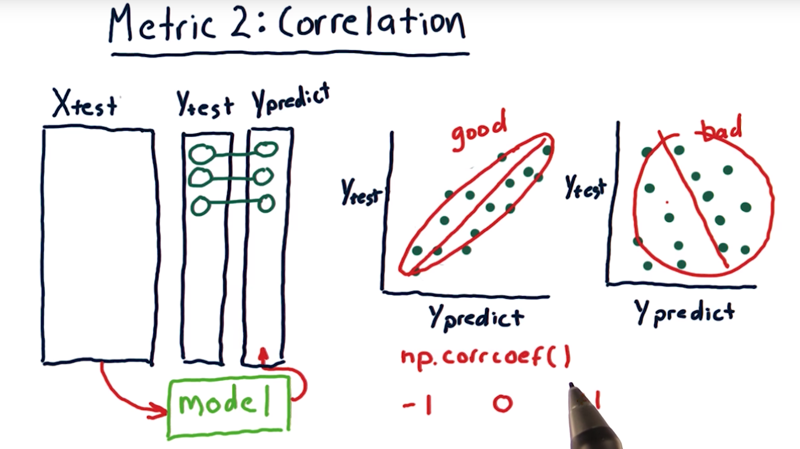
- Y_predict = f(X_test), and f(x) is the model
- the correlation between Y_predict and Y_test can be used to evaluate model f(x).
- correlation value (r) range is [-1, 1]. when r is close to 0, the correlation is low. when r is close to 1, the correlation is positively strong; when r is close to -1, the correlation is still strong but the variables are inversely correlated.;
np.corrcoef()to measure the correlation between Ytest and Ypredict.- visualization:
- High correlation means the line and dots are well aligned as a nice oval that fits close to that line,
- If it’s a big round thing we’ve got poor correlation.
Time: 00:02:14
11 - Correlation and RMS error
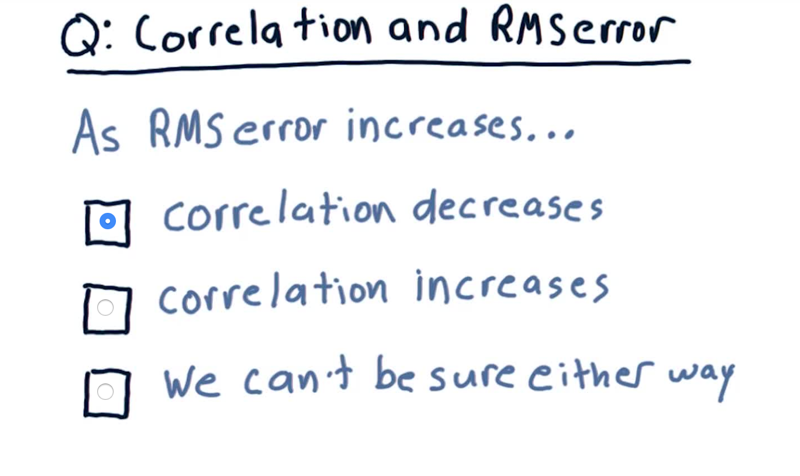
My answer is: when error decreases, the correlaion become stronger. But the value could go both ways as correlation becomes stronger. E.g.: Negative correlation is stronger when the r value decreases, but when correlation is positive, it is stronger when the r value increase.> Time: 00:00:30
12 - Overfitting
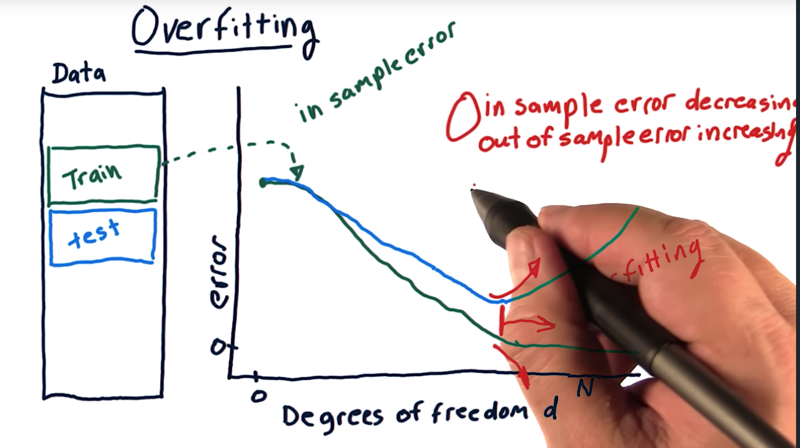
In the graph:
Example: parameterized polynomial models where we can add additional factors, like x, x squared, x cubed, x to the fourth, and so on.
- then measure error as we increase d (degree of freedom, which is related to the number of factors) on our training set.
- The in-sample error will start high can decrease to 0
- The out of sample error will also start high, decrease as d increases and eventually start increasing again.
- the expected out of sample error is always be greater than or equal to in-sample error.
__ As we increase degrees of freedom, our in sample error is decreasing, but our out of sample error is increasing. And that’s how we define overfitting.__
Time: 00:02:14
13 - Overfitting Quiz
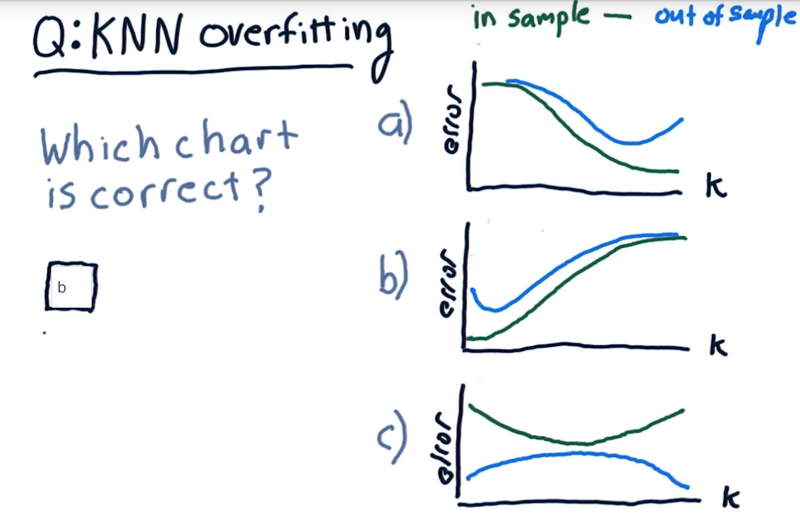
overfitting in KNN
As K increases, how the in-sample error and out-sample error will look like?
Overfitting Solution
The answer is b.
- When k = 1, the model fits the training data perfectly, therefore the in-sample error is low (ideally, zero). The out-of-sample error can be quite high.
- As K increases, the model becomes more generalized, thus out-of-sample error decreases at the cost of slightly increasing in-sample error.
Time: 00:00:57
14 - A Few Other Considerations Quiz
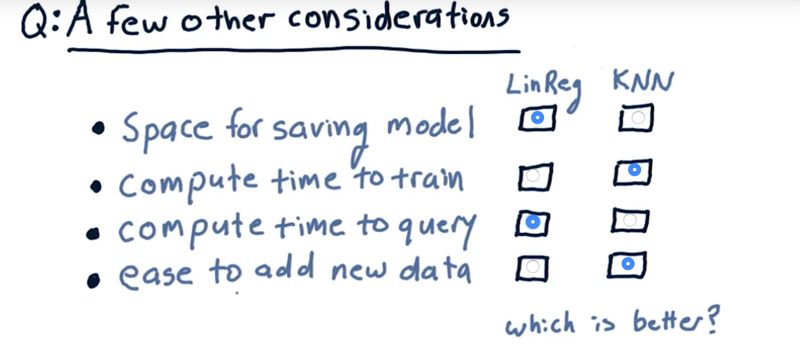 Which are better?
Solution:
- Linear regression does not need much to save the model but KNN requires all the data to be saved.
- Compute time to train. KNN takes zero time to train KNN. Linear regression has to take all that data, compute over it, to find those parameters.
- Compute time to query. LinReg wins. KNN requires time to query across all the data.
- Ease to add new data. KNN wins that because all you gotta do is just plop it in there, no re-calculation. With linear regression, you have to add the new data and then recompute the factors.
Time: 00:01:14
Total Time: 00:21:10
2019-01-28 初稿