- 01 - Technical versus fundamental analysis
- 02 - Characteristics
- 03 - Quiz: Potential indicators
- 04 - When is technical analysis valuable
- 05 - When is technical analysis valuable part 2
- 06 - A few indicators: Momentum
- 07 - A few indicators: Simple moving average (SMA).
- 08 - A few indicators Bollinger Bands
- 09 - Buy or sell
- 10 - Normalization
- 11 - Wrap up
01 - Technical versus fundamental analysis

Two broad categories of approaches to use for choosing stocks to buy or sell: Fundamental analysis and Technical analysis
Fundamental analysis: looking at aspects of a company to estimate its value and look for the price < value situations.
- earnings, dividends, cash flow, book value
Technical analysis: Looking for patterns or trends in a stock’s price.
Time: 00:00:36
02 - Characteristics
Characteristics of technical analysis
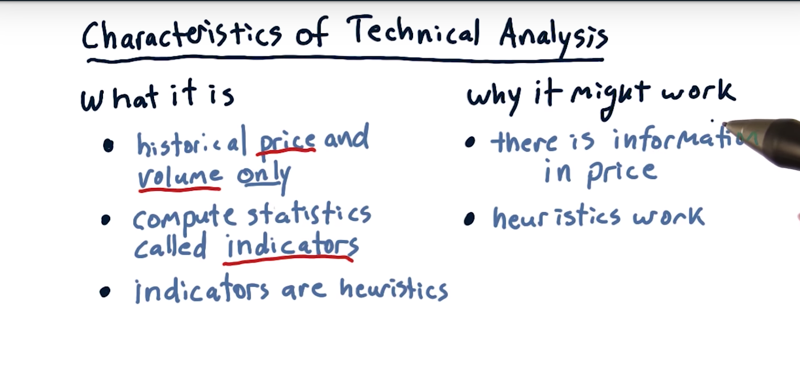
- it looks only at price and volume.
- compute statistics (or indicators) on this time series
- Indicators are heuristics that may hint at a buy or sell opportunity.
Criticism of the technical approach
- it’s not an appropriate method for investing, because it’s not considering the value of the companies.
- trading approach as opposed to an investing approach.
Reasons to believe technical analysis
- there is indeed information in price and information in a price change.
- Stock price and price change reflects sentiments of buyers and sellers
- in other domains of artificial intelligence, heuristics can work, and they work frequently.
Time: 00:01:40
03 - Quiz: Potential indicators
Look at each one of these four factors and fill in the box, T for technical or F for fundamental.
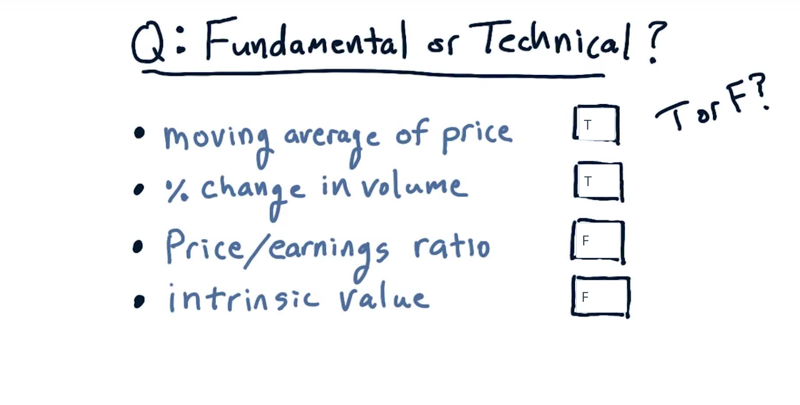
- the moving average of price is only using price [technical.]
- Percent change in volume is only using volume [technical].
- price/earnings, earning is a fundamental factor, which makes the whole [fundamental].
- intrinsic value is based on dividends [a fundamenta]
Time: 00:00:41
04 - When is technical analysis valuable
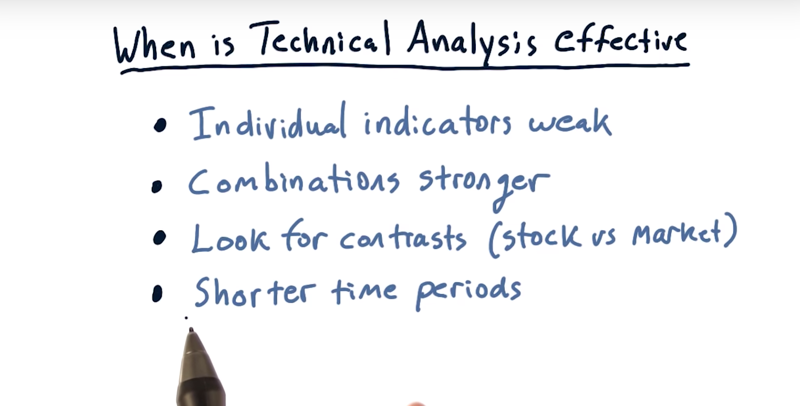
- individual indicators, by themselves, are weakly predictive. And the more people following a particular approach, the less value is realized
- combining multiple indicators adds value. Combinations of three to five different indicators, in a machine learning context, provide a much stronger predictive system
- contrasts. If certain stocks are behaving differently than the market, then they are worth a further look.
- technical analysis generally works better over shorter time periods.
Time: 00:01:38
05 - When is technical analysis valuable part 2
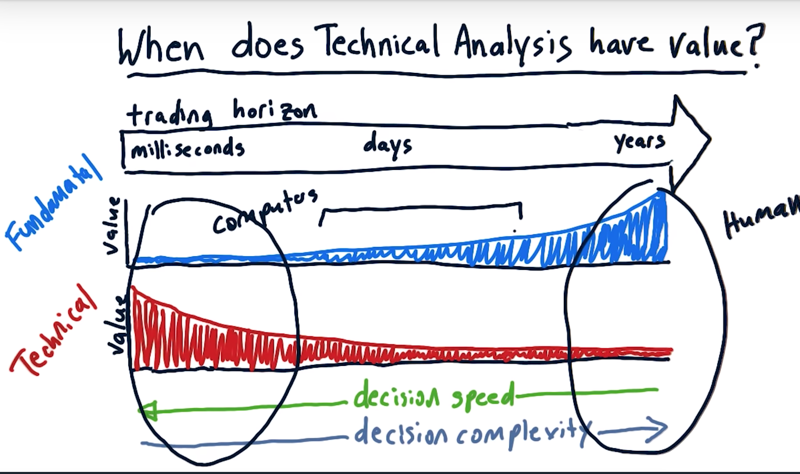
The trading horizon
For fundamental factors: Over long periods of time, fundamental factors provide a lot of value.
- For trading machines on the stock exchange, the order book or momentum, etc really matter, and the fundamental factors really have low value.
- fundamental factors over long periods of time may have significant value.
- over a period of days, Fundamental factors do have value.
for technical factors.
- over long terms technical analysis is not so valuable.
- technical factors potentially have high value over very short periods of time.
decision complexity
- Computer-based trading
- we have to be able to make the decisions really, really fast if we’re trading at the millisecond level.
-
at this very high-frequency trading, the complexity of decisions is simple. And computers excel in this region of the chart.
- the high-frequency trading computer-driven hedge funds are short in the trading horizon.
- human investors
- we can take a long time to make a decision if we’re going to buy and hold for years.
- If taking a long time to make a decision, it is the best region for human investors.
- The insight-driven, human-based hedge funds are operating over a long trading horizon.
- there is a middle where we often see humans and computers working together.
Time: 00:03:42
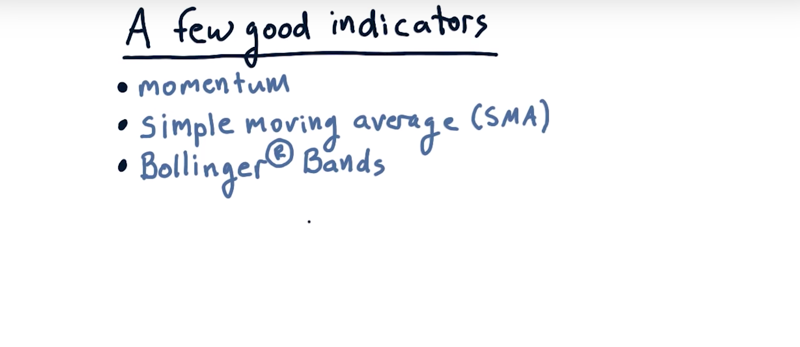
06 - A few indicators: Momentum
Three are some of the most common and most popular indicators: 1) momentum, 2( simple moving average, and 3) Bollinger Bands.
momentum
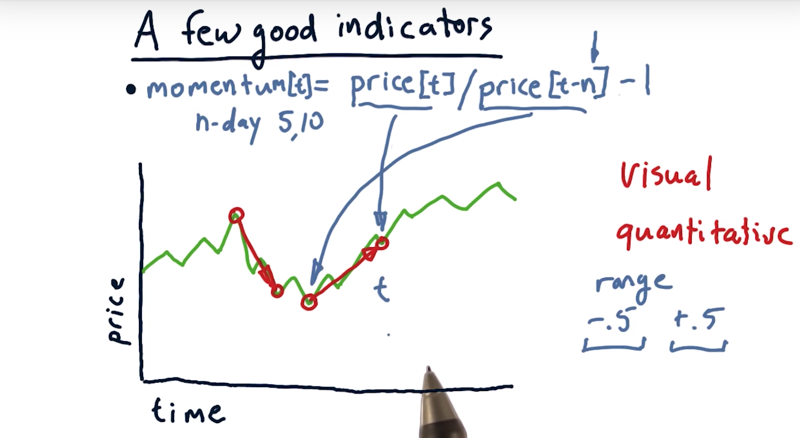
Momentum is over some number of days how much has the price changed: positive momentum and negative momentum
-
The steepness of that line is the strength of the momentum, either positive or negative.
-
convert numbers
momentum, N days of momentum. -
the pseudo code for how we compute momentum on a particular day.
momentum[t] = price[t]/price[t - n] -1, n is the number of days between two time point.
Time: 00:02:42
07 - A few indicators: Simple moving average (SMA).
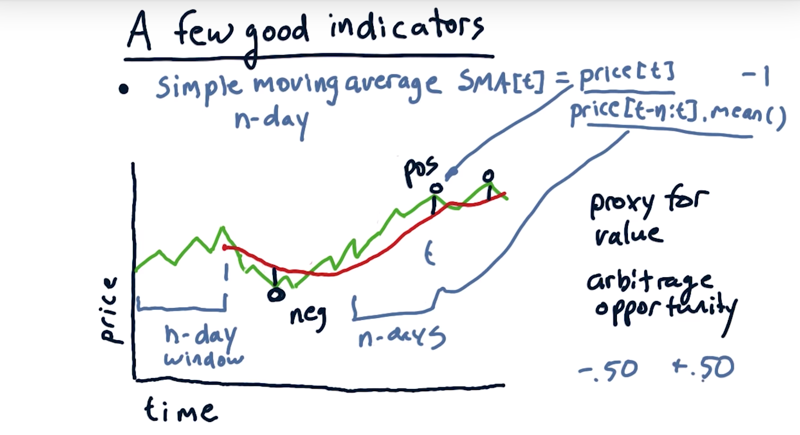
- SMA for today is simply the average of the values over this look back window.
- the SMA looks essentially like a smoothed value of the price chart as it moves around.
- SMA lags the movement.
two different ways that technicians use simple moving average
- look for where the current price crosses through the simple moving average.
- combine that with momentum: the price has strong momentum, and it’s crossing through that simple moving average, that can be a signal.
- strong momentum crossing those lines, then again, that can be a trading signal.
- simple moving average is as a proxy for underlying value.
- The average price might represent the true value of the company.
- we should expect that the price is eventually going to regress to that average. ( it’s an arbitrage opportunity)
quantify SMA
- compare the current price with the current simple moving average, and construct a ratio.
SMA[t] = price[n]/price[t-n:t].mean() -1- This value ranges from -50% to +50%.
Time: 00:03:40
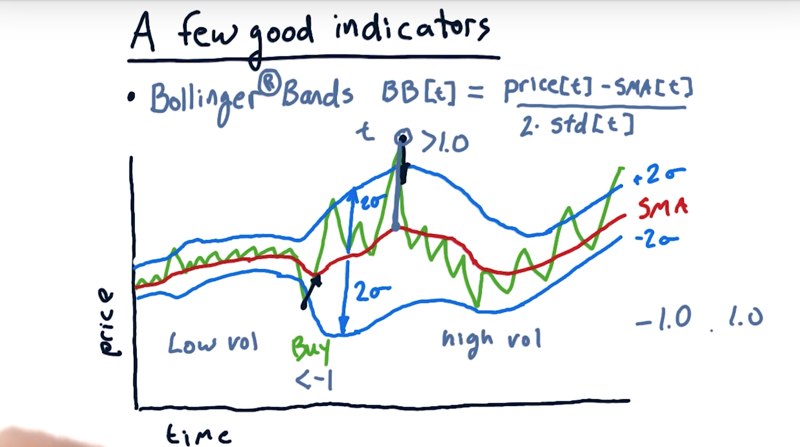
08 - A few indicators Bollinger Bands
how much of an excursion from the simple moving average should I use as a signal for a buy or sell?
- a fixed number is probably not the best way to go.
- John Bollinger observed that for low volatility, use a smaller excursion for that trigger. For high volatility, use a larger number.
- the Bollinger Bands: take this simple moving average, but let’s add a band above and below 2 std (standard deviations).
How might we use Bollinger Bands now for trading signals
- look for times where the price’s outside one of these Bollinger Bands and when it crosses to the inside it should be a trading signal.
- Moving from above the band and cross to the inside, selling signal
- Moving from below the band and cross to the inside, buying signal
How to calculate the Bollinger Band on a particular day t
BB[t] = (Price[t] -SMA[t]) / (2*std[t])- BB[t] = -1 or BB[t] = 1 are the crossing point.
- BB[t -1] > 1and BB[t] = 1 and BB[t+1] > 1, then Sell
- BB[t -1] < -1and BB[t] = -1 and BB[t+1] <- 1, then buy
- typically expect to BB[t] is between -1 and 1.
- occasionally, we’ll see excursions above and below those values.
Time: 00:03:46
09 - Buy or sell
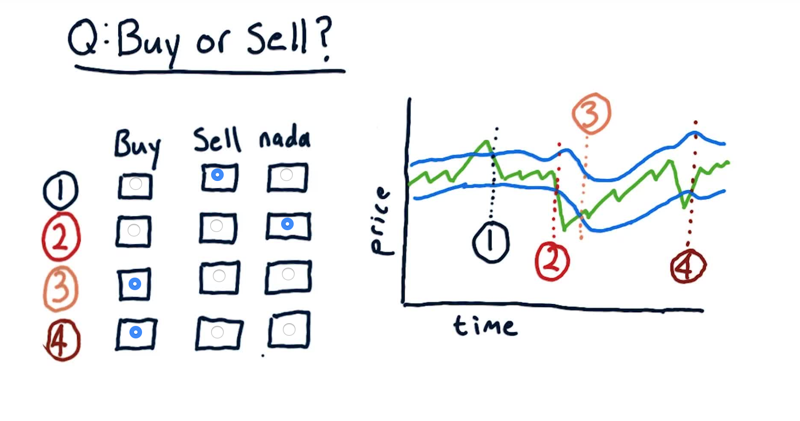
In the four different times where the actual price crosses and upper or lower Bollinger band. Is it a buy signal, a sell signal or no signal at all?
The solution: is in the picture: remember, only when price moves into the Bollinger Band is a trading signal. Moving outside is not.
Time: 00:00:57
10 - Normalization
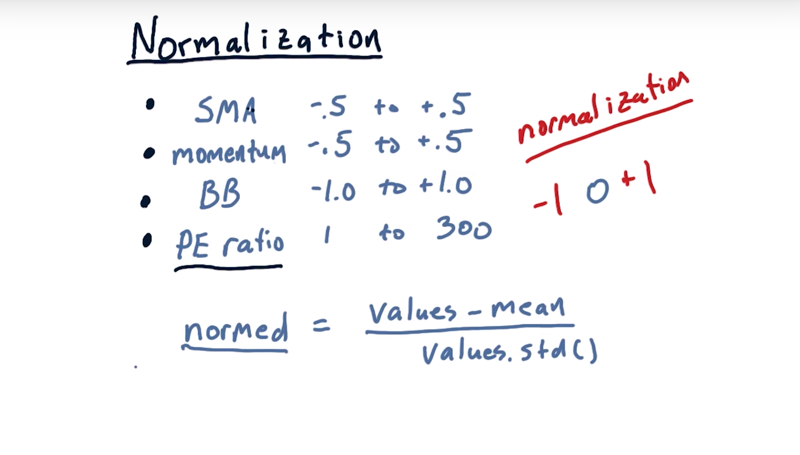
- Simple moving average and momentum are bouned in [-.5, +.5] and Bollinger bands in [-1, 1].
- When used in a machine learner Bollinger Band factor would tend to overwhelm these other factors and [falsely] become the most important one.
- It might get even worse if we included fundamental factor like PE ratio ranges in [1, 300]
The solution: normalization.
Given values, the normalization works this way:
normalized_values = [values - mean(values)] / std(values)- normalized_values will range in [-1, 1] and have a mean of 0.
⚠️!!Normalize your data if use indicators in machine learning models!!
Time: 00:01:43
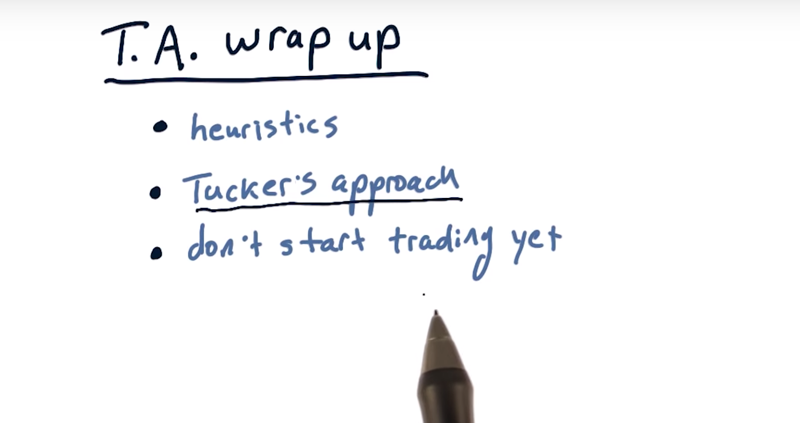
11 - Wrap up
-
technical indicators are really heuristics that represent how a statistical approach to previous prices and volume might suggest future price movement.
-
Tucker’s approach of using Bollinger Band.
-
🙅♂️Do not start trading. Learn more
Time: 00:00:49
Total Time: 00:22:34
2019-02-20 初稿