- 01 - Lesson Overview
- 02 - How data is aggregated
- 03 - Quiz: Price anomaly
- 04 - Stock splits
- 05 - Quiz: Split adjustment
- 06 - Dividends
- 08 - Adjusting for dividends
- 09 - Survivor bias
01 - Lesson Overview

- The core data and the primary data we will work with in this course is historical price and volume data.
Time: 00:00:13
02 - How data is aggregated
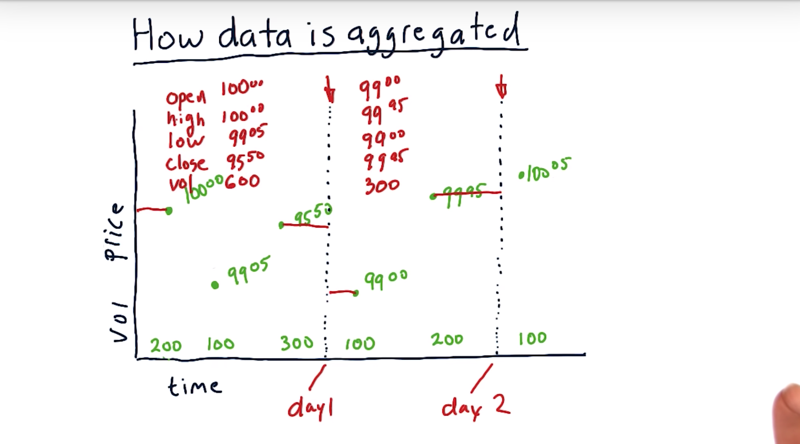
- The finest resolution of data is called a tick which represents a successful by sell match (transaction).
- transaction happens only when a buy and sell are matched.
- Each exchange provides its own data feed regarding these transactions. The prices and the volumes of the transactions from different exchanges can be different
- Tick data is usually consolidated into minute by minute or hour by hour chunks.
- open value: the price of the first transaction in the time period
- High, the highest price in the time period
- Low: lowest price in the time period
- Close the last transaction in the time period
- volume, the total volume during that time period.
- The smaller the time period, the more computing, faster computing, more and larger databases, and so on are required. the data we’ll be working with in the course is daily data
Time: 00:04:03
03 - Quiz: Price anomaly
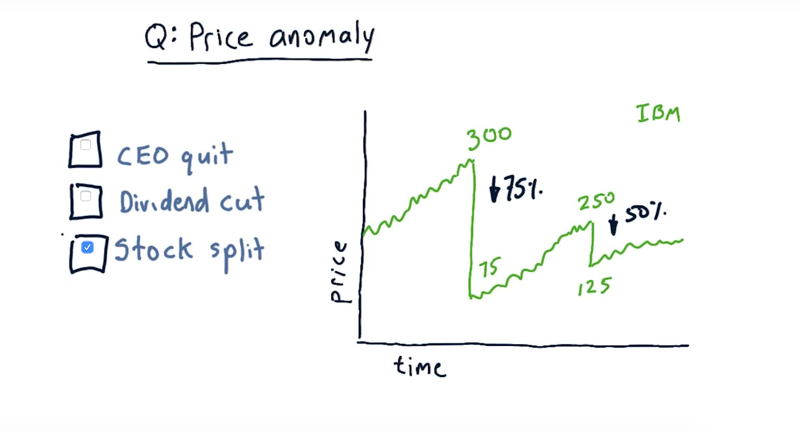
why might the price of IBM dropped by this significant amount over these days?
Solution: stock split.
When stock split happens, your total value was preserved, but you now have more shares. In other word, N = price_pre_drop / price_past_drop, and N is usually an integer.
Time: 00:00:38
04 - Stock splits
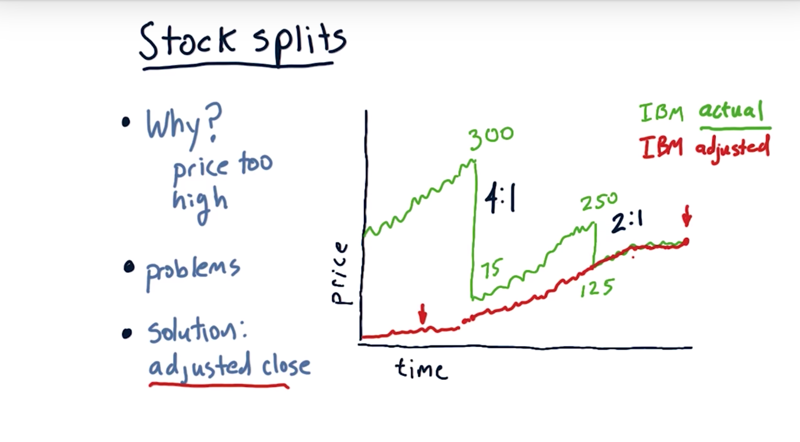
Stocks splits When the price is too high.
Why is a high price a problem?
- Trading high price stock options is very expensive and less liquid.
- High price can stop people from even buying even one share because it is an expensive transaction.
-
High price stocks make it difficult to fine-tune stocks in your portfolio.
- 4 of 1 split: take that 1 share that’s the price at $300 and break it into 4 shares
Stock splits look like a short opportunity because the stock price have a sudden drop. This drop in price is not a drop in the value of the company or your stock value. Investors only have more stocks in their hands without a change of the total value. solution: adjusted close Or adjusted prices.
- create a timeline of prices that are adjusted to account for these changes.
- when we see a 2 to 1split then we go back over all the historical data, and we divide it all by 2.
- if we see a 4 to 1 split, then we divde the historical data agian, by 4. etc…
Time: 00:04:51
05 - Quiz: Split adjustment
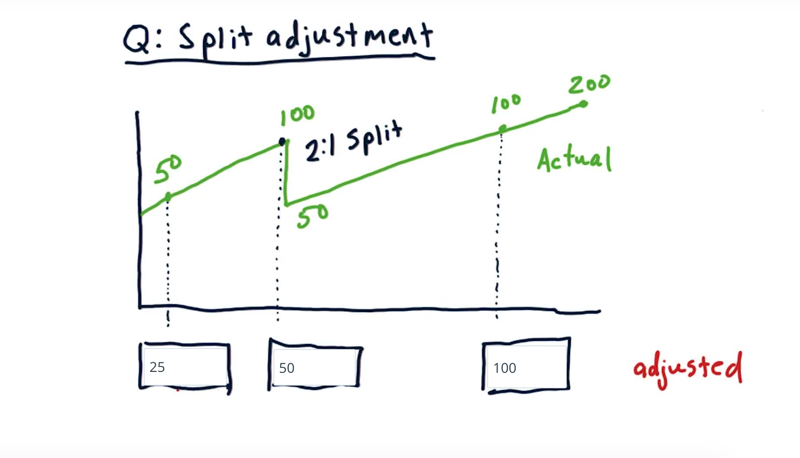
The price (green line) has a 2:1 split, what are the corresponding adjusted closing prices?
Time: 00:00:26
Solution: For prices before the split, we divide them by 2, for prices on and after the day of the split, no change.
Time: 00:01:05
06 - Dividends
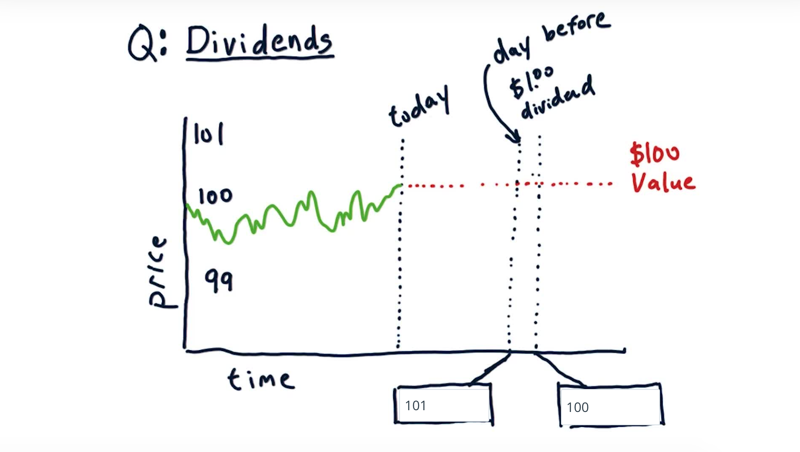
Dividends can affect the actual price of the stock:
Given a stock price at $100/share, it announces to pay a $1 dividend on a future date.
- Supposing the company is worth $100 per share.
- So on the date of dividend distribution, we’ll have one share stock and $1 dividend, worthing $101.
So what prices will be on the day before the dividend is paid and the day the dividend is paid?
Solution:
- before the dividend day, stock price = 101, because everybody that’s what you will get the next day
- On the dividend day, the price = $100, and the shareholder will have one share of stock and $1.
Time: 00:00:59
08 - Adjusting for dividends

- The dividend will cause the stock price to drop on payout day.
- the announced day, in general, the price rising up until the payout day
How we might adjust historical prices for this situation.
- the same way of dealing with a split
- adjusted price as of the payout day or the latest day in our data, is always the same as the actual price.
- The adjusted price before the dividend is paid will be adjusted down by the proportion of the dividend.
The adjustment allow us to not worry about dividends and splits
- the last day in our file, usually that’s as of today, the adjusted and actual close value are the same.
- the adjusted value of a stock at a certain day is dependent on the last date of the data.
- the adjusted close price of a day calculated with data gathered in 2012 will be different, most likely higher, than the adjusted close price
Time: 00:04:02
09 - Survivor bias
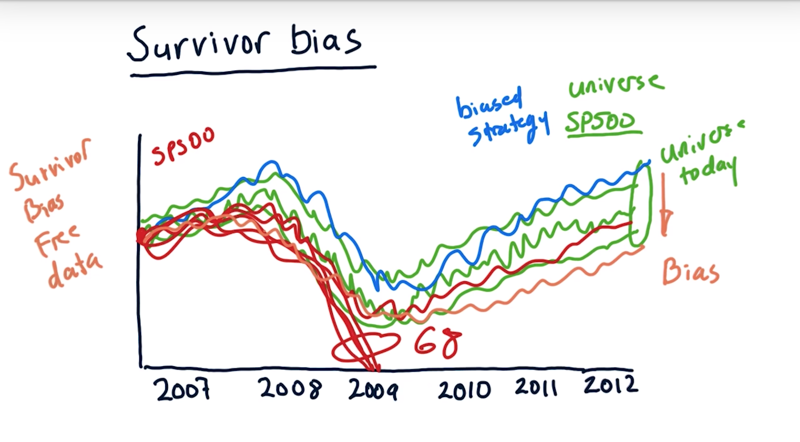
- If using stocks in an index (e.g. SP500) to run a simulation, we need to make sure not use only the stocks that are currently in the index. You will have Survivor bias this way
- E.g., 68 company in the 2007 S&P index died over time thus not in the current index.
- When simulating trading applying algorithm to choose which stocks you might buy. the difference between the performance of using the historical combination of stocks (red line) and the current combination (blue line) is the bias.
- use survivor-bias-free data for simulation (The data is not usually free, but not necessarily that expensive either).
Time: 00:02:26
Total Time: 00:21:39
2019-02-24 初稿