- 2 - What is the risk
- 3 - Visualizing return vs risk
- 4 - quiz: Building a portfolio
- 5 - Can we do better
- 6 - Why covariance matters
- 7 - Mean-Variance Optimization
- 8 - The efficient frontier
##1 - Overview
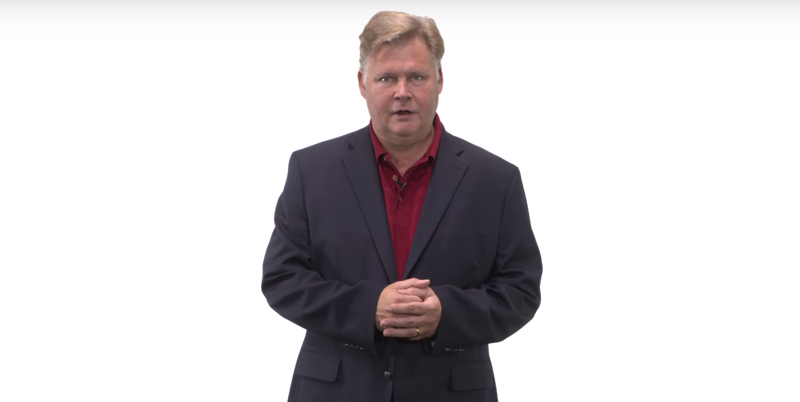
Mean-variance optimization (or portfolio optimization) is a way to decide how much of your portfolio should you invest in each?
The specific question: Given a set of equities and a target return, find an allocation to each equity that minimizes risk.
Time: 00:00:29
2 - What is the risk
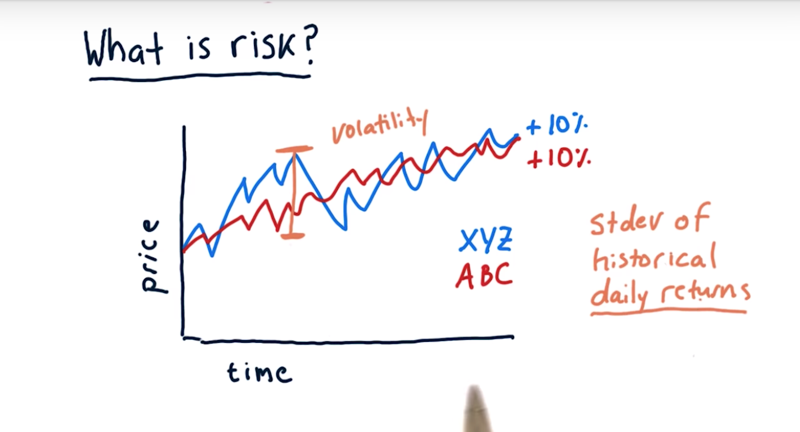
The standard view of risk in most finance texts, the risk is measured as volatility or standard deviation of historical daily returns. e.g, XYZ is more volatile than ABC, thus is riskier.
Time: 00:01:00
3 - Visualizing return vs risk
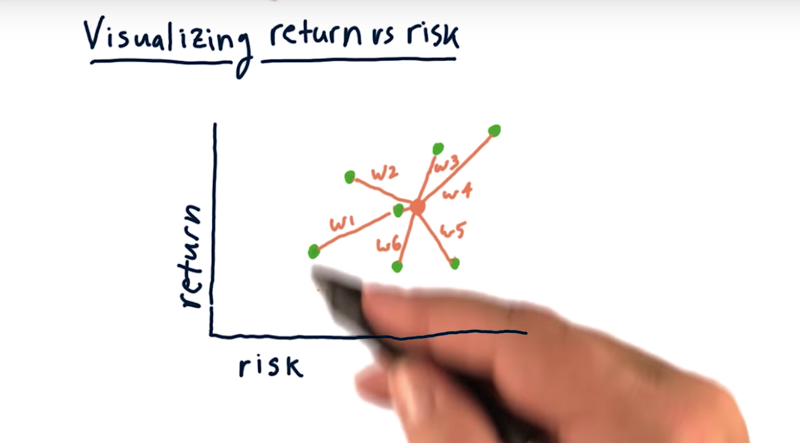
How to evaluate stock risk versus return: plot them on a scatter plot where each dot here represents one stock and the X and Y axis is the risk and return, respectively.
Then we can spot stocks with higher return with lower risk, or identify stocks have a higher return at the same or similar risk.
- we can build the portfolio by combining multiple assets, weight each asset by a particular weight.
-
It’s typically got a risk somewhere in the middle there and a return somewhere in the middle
- generally the higher return stocks or assets tend to also be the highest risk
Time: 00:01:16
4 - quiz: Building a portfolio
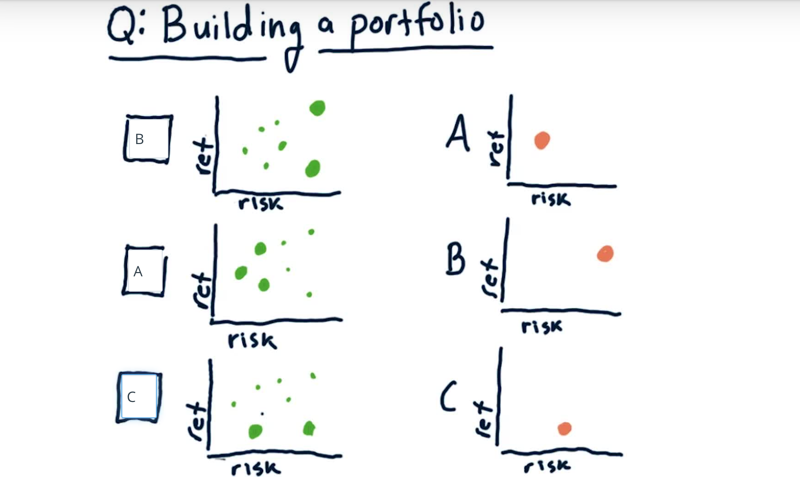
three portfolios on the left, the position of each of the green dots represents an asset with certain risk and return. The weights of the assets are represented by the size of the dots.
What are the risk/return levels for the portfolios on the left?
Solution: the return/risk of the portfolio is more affected by the stocks with higher weights.
Time: 00:00:44
5 - Can we do better
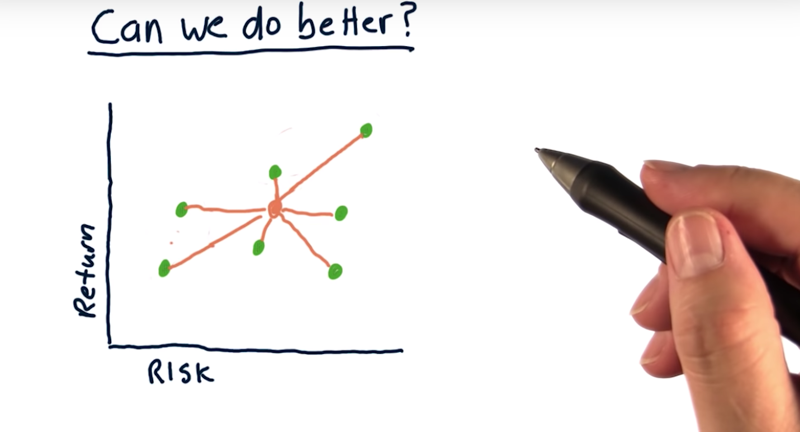
Traditional ways to built portfolios.
- cluster assets based on risk and return
- more weights on low-risk assets when building low-risk portfolios
- More weights on high return assets when building high-return portfolios.
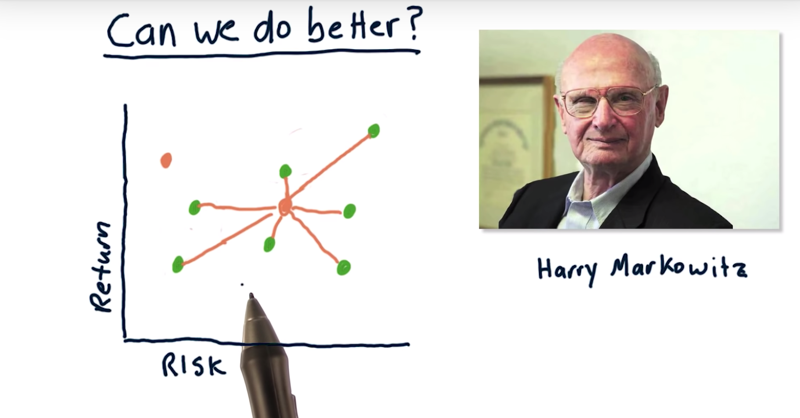
Now, can we do better?: e.g have a low-risk portfolio with a higher return or a high-return portfolio with less risk? The answer is YES.
- Harry Markowitz, who won the Nobel Prize for his insight.
- covariance: the relationship between stocks or how they interact day to day.
- Markowitz showed that a blend of stocks and bonds have lower risk than either one of those by themselves.
Time: 00:02:03
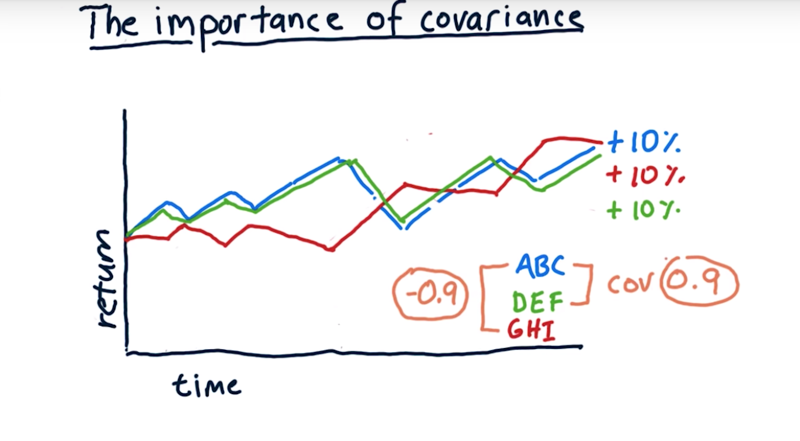
6 - Why covariance matters
-
example:
- Stock ABC, DEF and GHI have the same accumulative return of 10%.
- ABC and DEF almost overlap. The covariance of the two is 0.9
- ABC and GHI move to a different direction. The covariance of the two is -0.9
- covariance, when looking at one stock versus another, is the same as the correlation coefficient of their daily returns.
what’s the best way to blend these together?
- portfolio 1: 50% ABC and 50% DEF.
- the portfolio has the same volatility as the volatility of ABC and EFG.
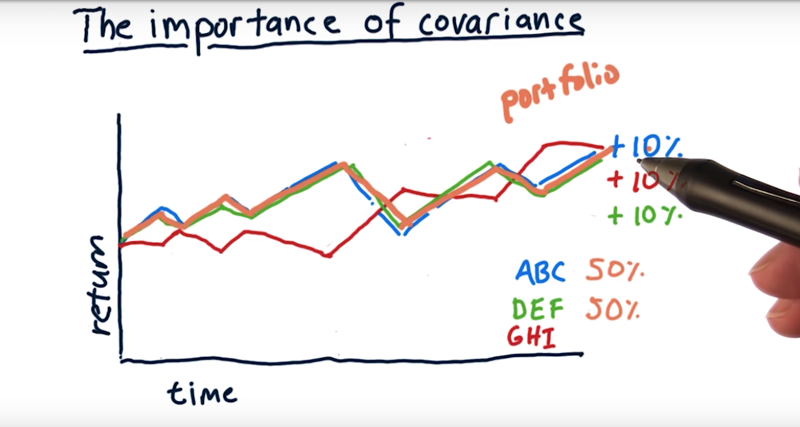
- Portfolio 2: 25% of ABC, 25% of DEF, and 50% of GHI?
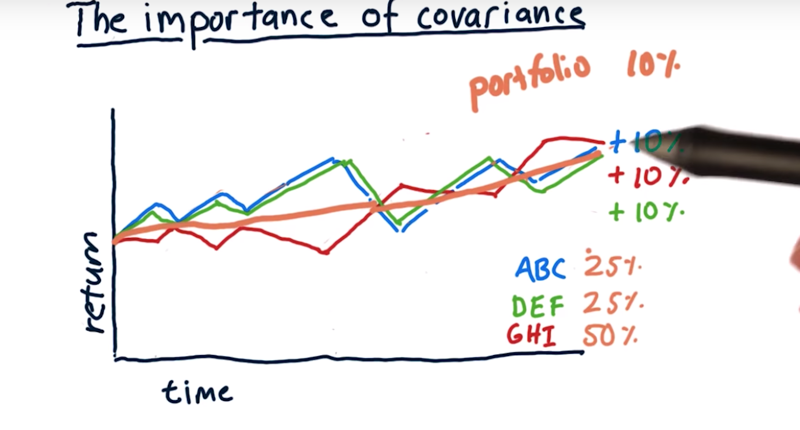
- ABC and DEF are highly correlated. combine the two will not change volatility.
- but when combining an anticorrelated asset with these other two, the portfolio return is much more smooth (lower volatility) with the same rate of return. These assets by themselves had significant volatility, but when we put them together, we reduced volatility significantly.
Time: 00:03:34
7 - Mean-Variance Optimization
Blend stocks that have anti-correlation or anti-varianced
- they cancel each other out so you have much less volatility.
- but we also need to make sure all these assets to in general move up together.
- anti-correlation in the short term and positive correlation in a longer term.
mean-variance optimization
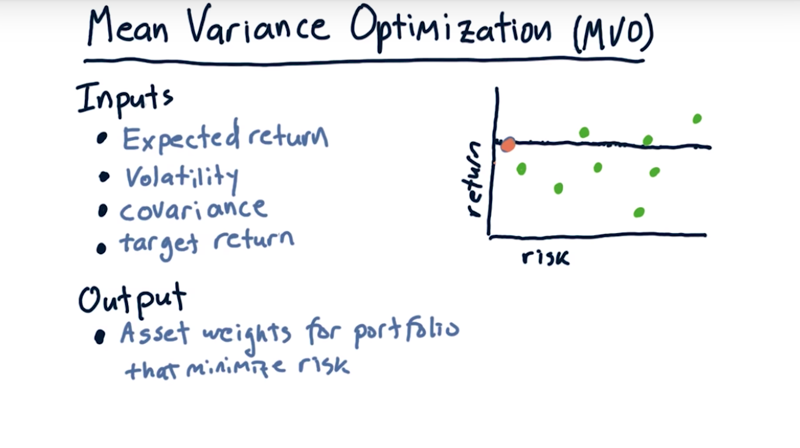
- Input:
- expected return for each stock in the future.
- volatility: use historical data to determine
- covariance: a matrix which shows the correlation of daily returns between each asset and every other asset
- target a return anywhere from the max return asset to the min return asset.
- output:
-
the output of an optimizer is a set of weights(one weight for each asset) that provides the target return but minimizes the risk
- it is possible to find a portfolio that is high return with low risk because we consider covariance.
Time: 00:03:25
8 - The efficient frontier
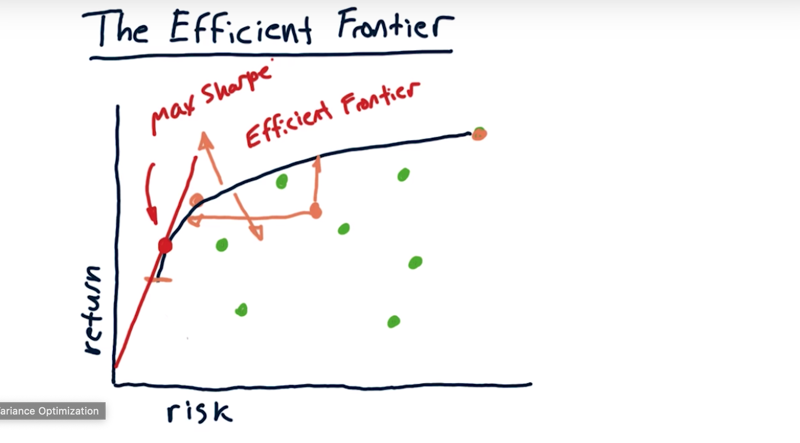
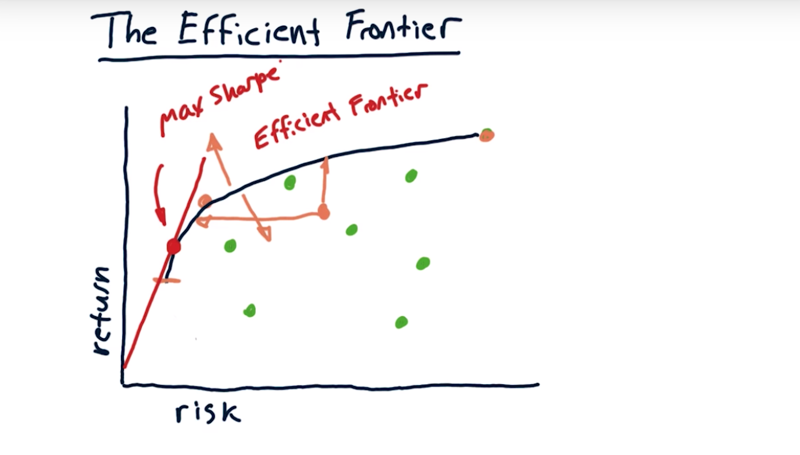
- Given a group of assets, for any particular return level, there is an optimal portfolio.
- If we calculate the optimal portfolios for the return levels, we get a line
- Now as you reduce the return sometimes this curve comes back in this direction, indicating that actually, the risk is increasing as we reduce the return. we typically look only at portfolios above this line.
- This line is the efficient frontier.
So what does the efficient frontier mean?
- There are no portfolios out the curve.
- Any portfolio that’s on this side of the frontier, it’s suboptimal in some way.
- if draw a tangent line from the origin to the frontier, where it hits the efficient frontier is the max sharp ratio portfolio for all of these assets.
In practice, the efficient frontier is a theoretical device, but people do often like to plot the efficient frontier to evaluate the portfolio i
Time: 00:02:54
Total Time: 00:16:15
2019-03-05 开始
2019-03-13 完成
2019-03-14 重新发布