本学期学习Machine Learning。本课程在Udacity上有免费版本,并提供详细的笔记。本文的笔记是超级脱水版,目的是自用。
Week 01 tasks
- Lectures: Decision Trees, Regression and Classification, and Neural Networks.
- Reading: Chapters 1, 3, and 4 of Mitchell
SL1 Decision Trees
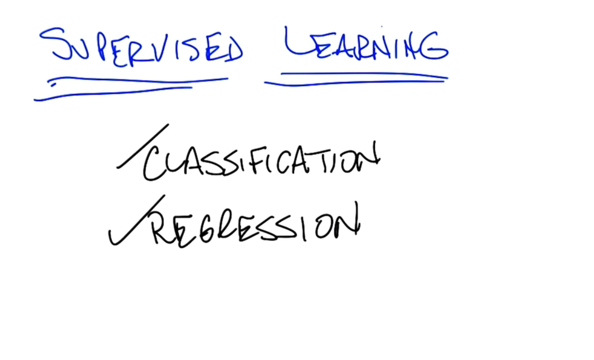
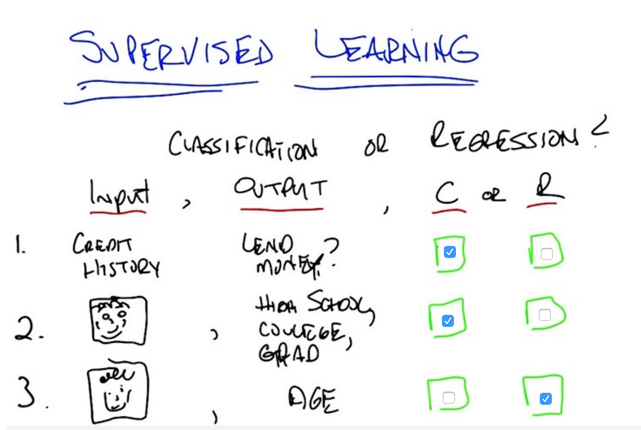
- Classification is simply the process of taking some kind of input, x, and mapping it to some discrete label.
- And regression is mapping from some input space to some real number
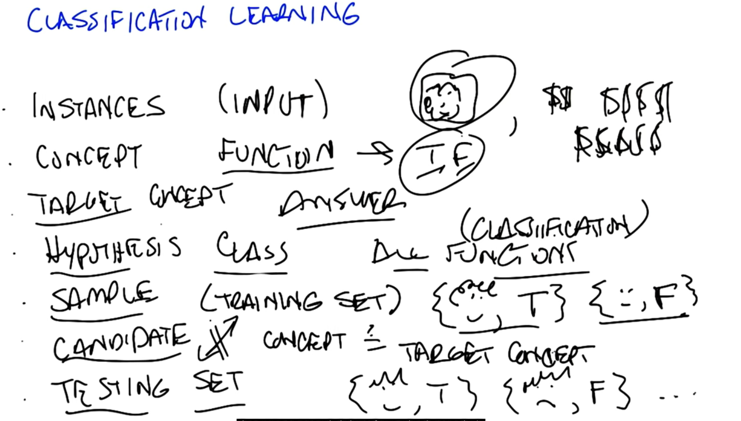
- Instances is input;
- Concept is the function to generate labels
- Target concept: answer the question
- Hypothesis: all possible concepts?
- Sample: the training set
- candidate: all concepts of the target concept
- testing set
- TEsting set should never be the same as the training set to show generalization.
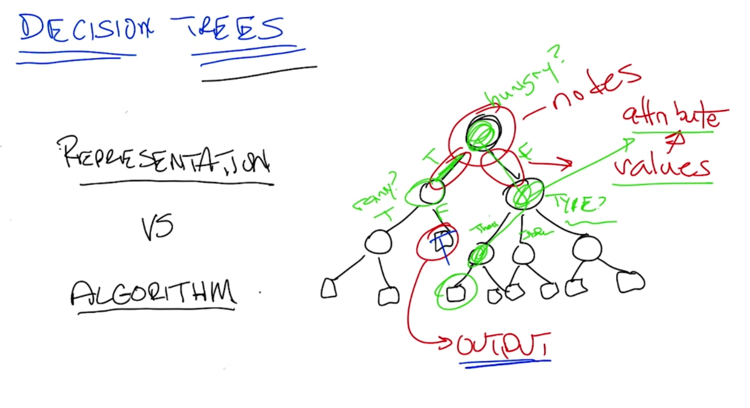
- start with the root node
- edges represent different choice
- leaf is final output
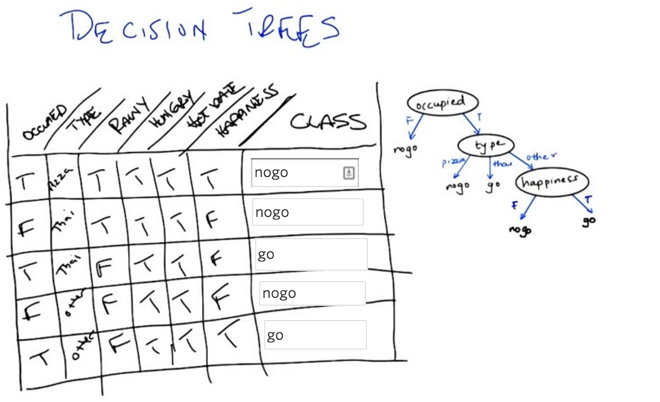
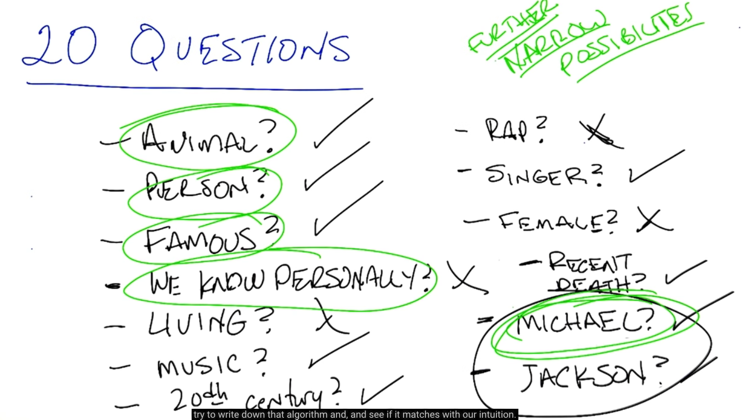
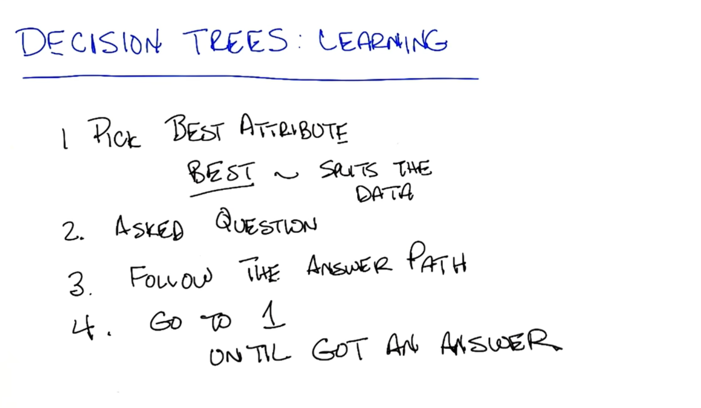
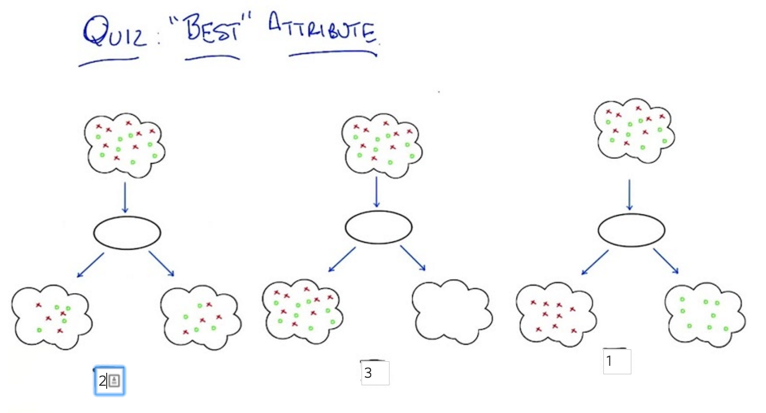
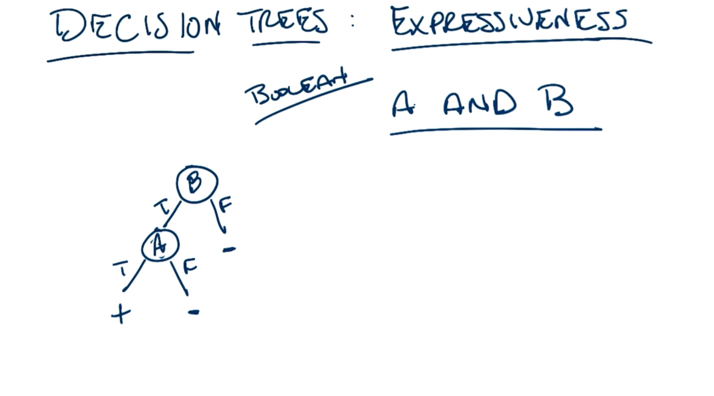
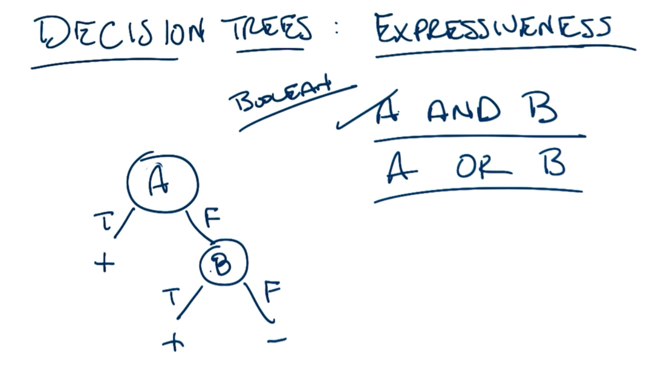
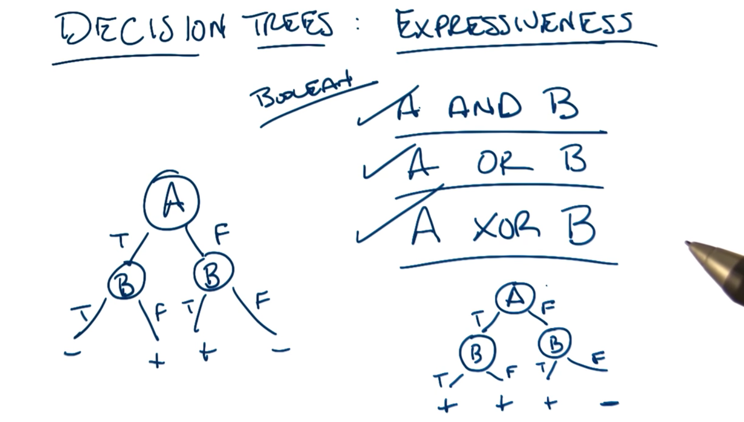
- A and B are commutative so that switching the position of A and B on the trees above is OK
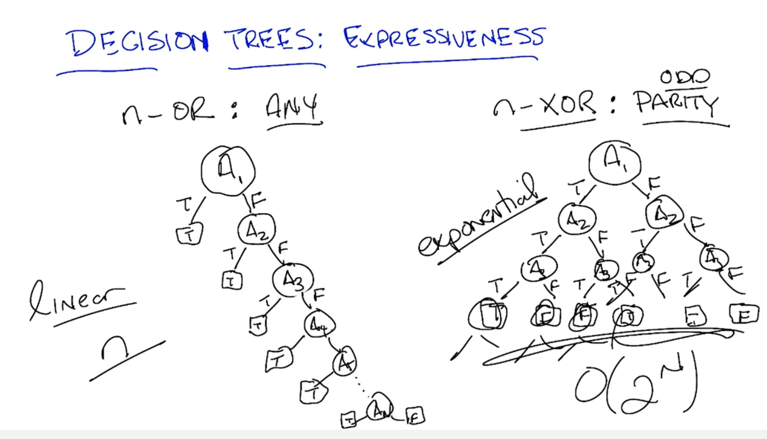
- Linear tree: number of nodes = number of attributes
- exponential tree: number of nodes grows exponentially to the number of attributes
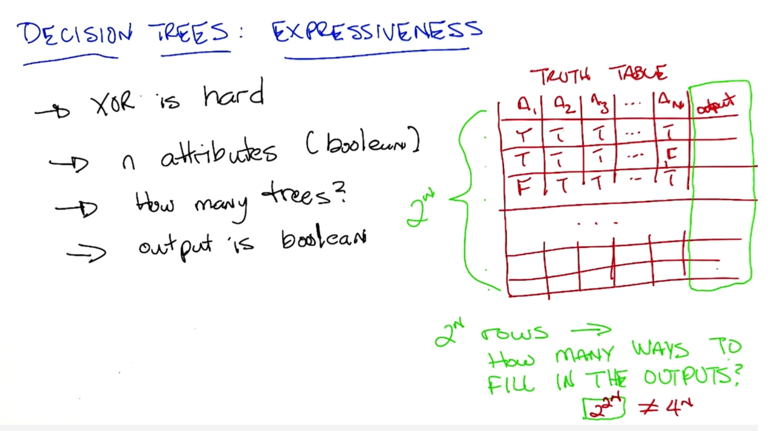
- the number possible trees can be huge
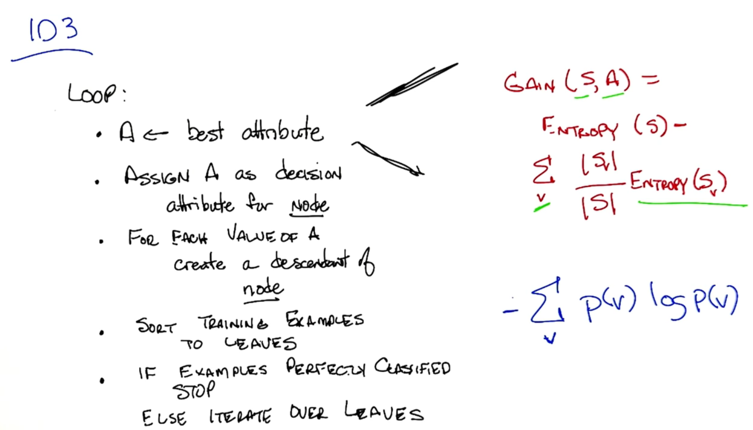
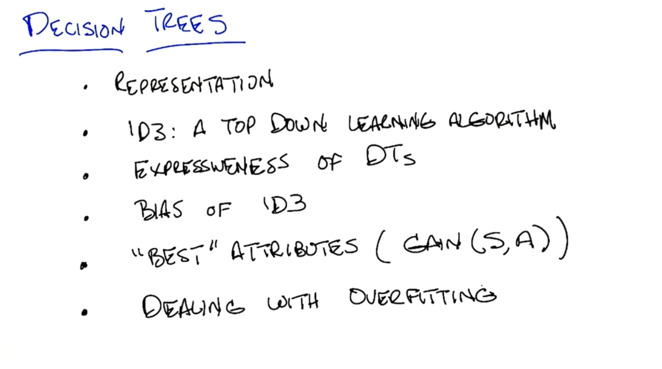
- information gain:
- What is Entropy? - a measure of randomness。 ∑P(v) log(P(v))
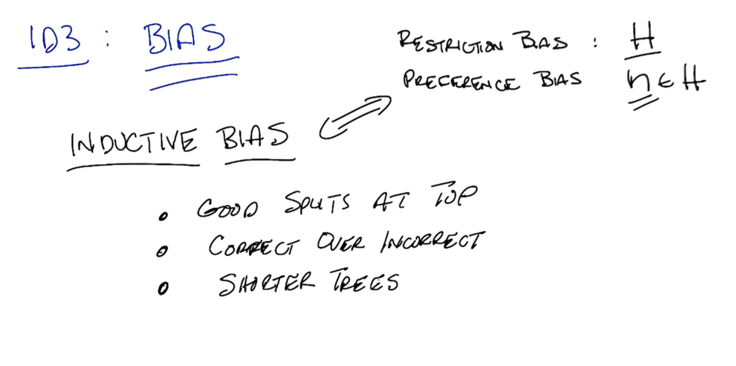
- The inductive Bias of ID3 is (Preference bias)
- good splits at top
- correct over incorrect
- shorter trees
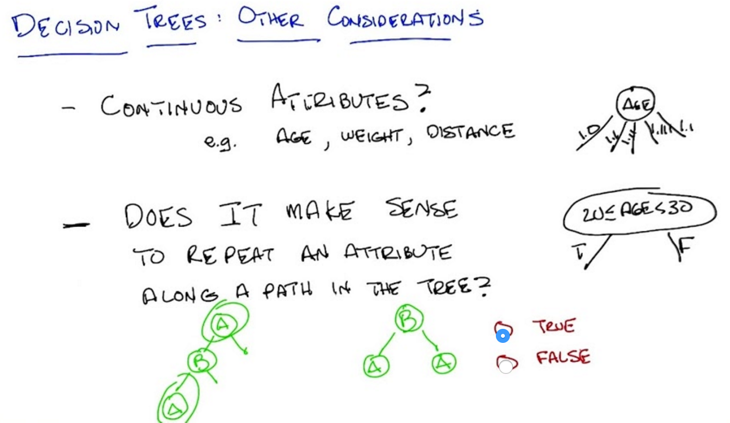
- For continuous-valued Attributes, we can group them by a range
- It does not make sense to repeat a discrete-valued attribute, but continuous attribute could be repeated if a different question is asked.
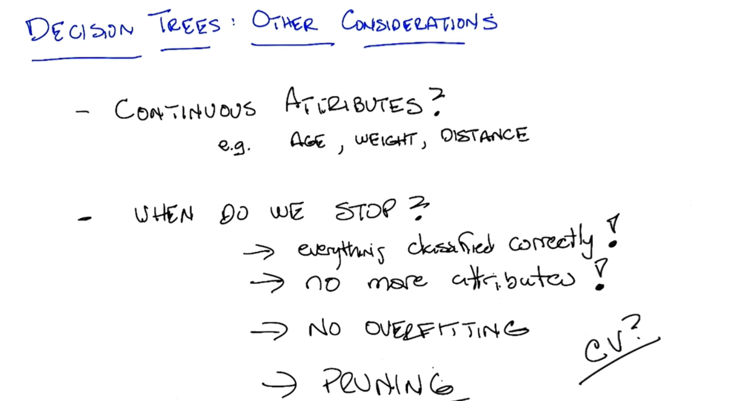
- all attributes are correctly classified: this can’t happen if data is noisy.
- Run out of attributes: if attributes are continuous, will never run out.
- No overfitting: pruning.
SL2: Regression and Classification
Recap: Supervised learning: learn from pairs of input and output, then given a new set of input, predict the output. This is mapping input to output. If the output is discrete, it’s classification. If the output is continuous, it is Regression.
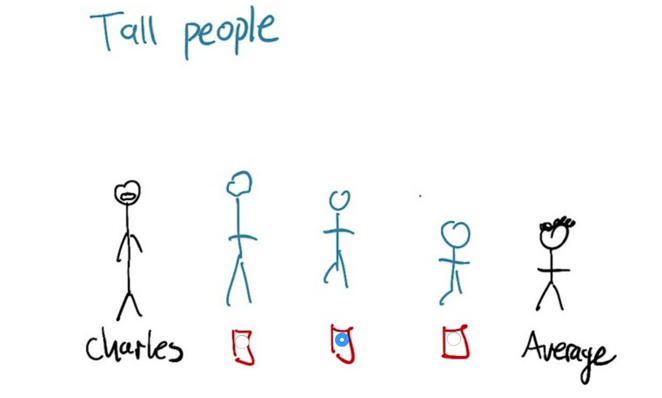
- Originally, regression means regress to the mean
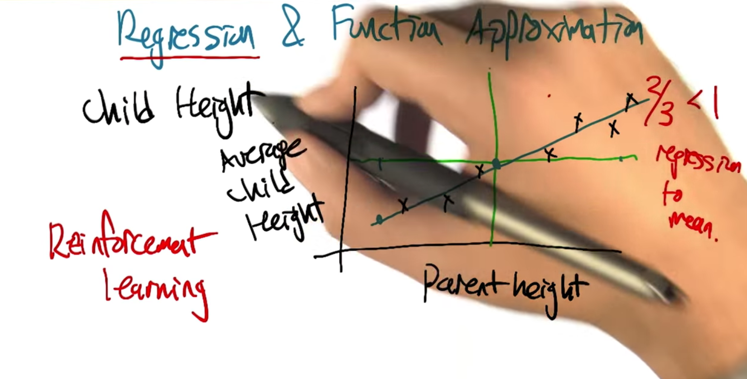
- regression now means the find the function to represent to the relationship of 2 variables.
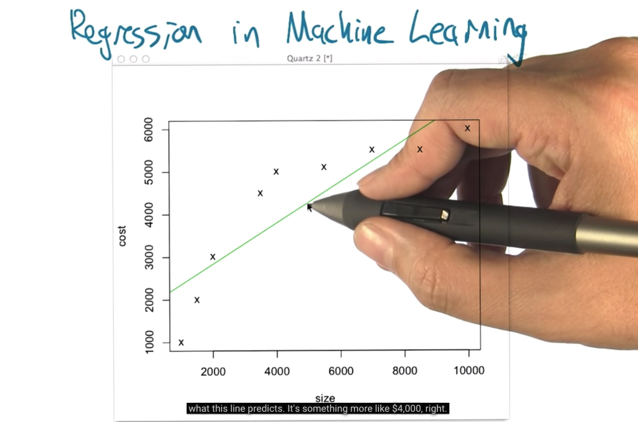
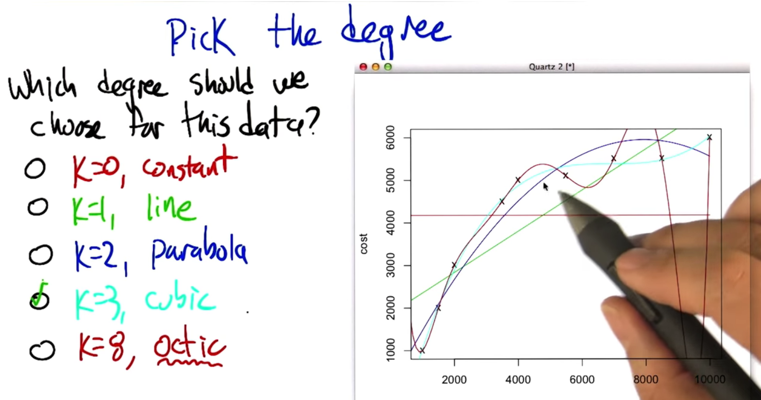
- the green line is the best fit linear line, but is it the best line?
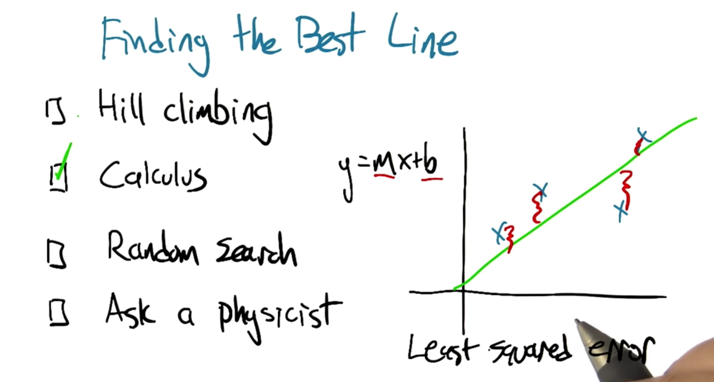
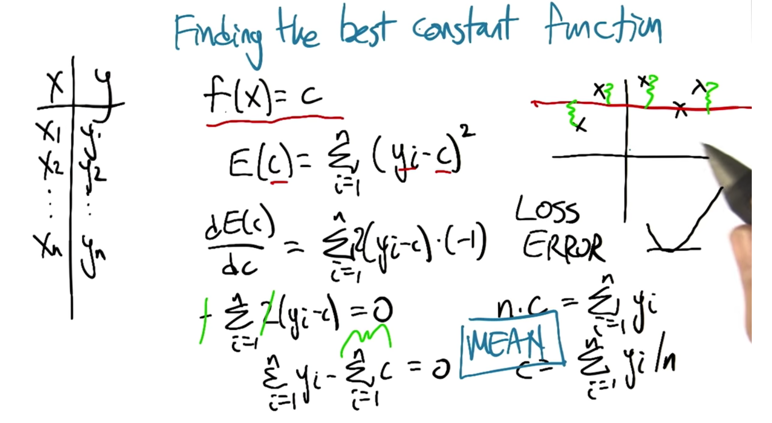
- the best constant function is the mean of Y.
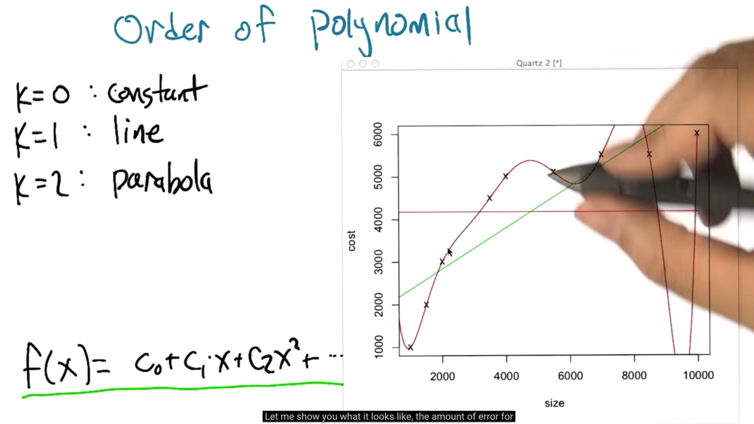
- in the case, the error for order = 8 is zero
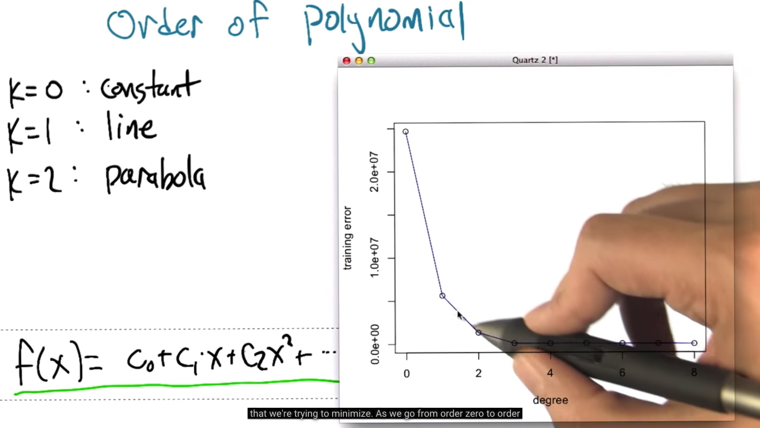
- Problem: overfitting
Polynomial Regression
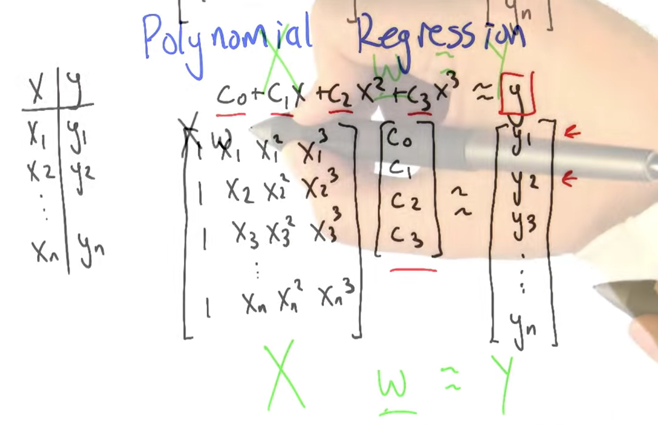
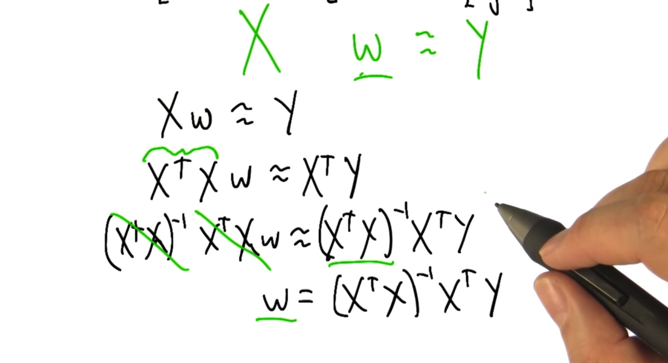
- here shows the polynomial regression represented by matrix and vectors.
- the coefficient is computable
Errors
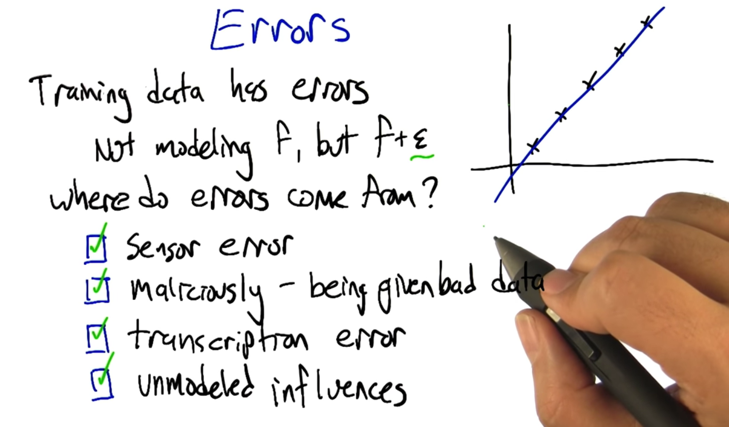
- Sensor Error: The actual reading was 10, but a moth landed on the sensor so it read 0 instead.
- Malicious Error: An intelligent malicious agent got in between the measurement and the receiver of the data, they edited the data to say what they wanted it to say, rather than what it actually was.
- Transcription Error: A machine copied a number from one place to another and it flattened all of the E notation floats to a bare integer. Or a program cast a UTF16 hieroglyphic to a Unicode pile of poo.
- Unmodeled influences: Suppose we are predicting house prices based on square footage and the number of bathrooms. The house price sold for very low value and the reason was that of an unmodeled influence, that there was mold in the attic and walls. The unmodeled influence caused the Machine Learning to fail at predicting a low house price.
Cross Validation
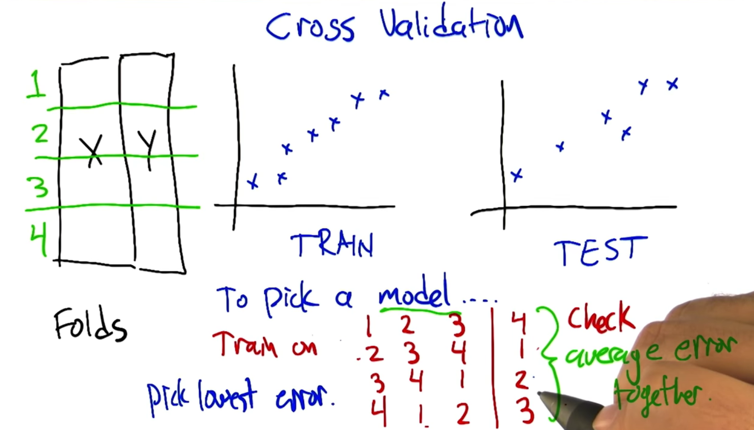
- the goal is to generalize to the world, not to fit certain training or testing data set perfectly.
- we need the training and testing data to be IID: independently identically distributed (Fundamental assumption)
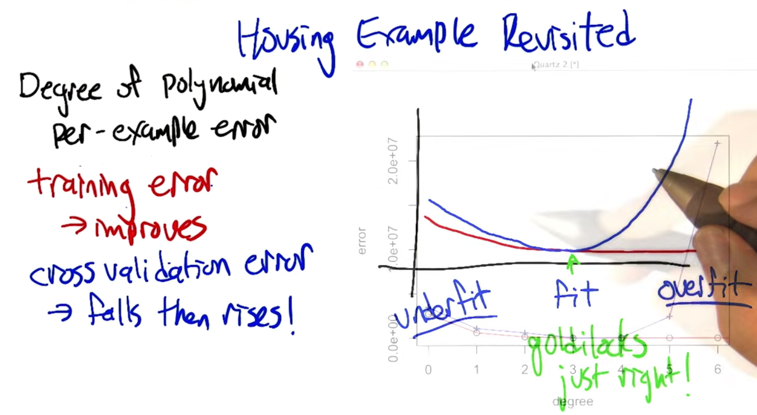
- We can split the data into folds and training while leaving one out and use the one for testing. then we average the error of all combinations. Pick the model with the lowest cross-validation error.
SL3 Neural Networks
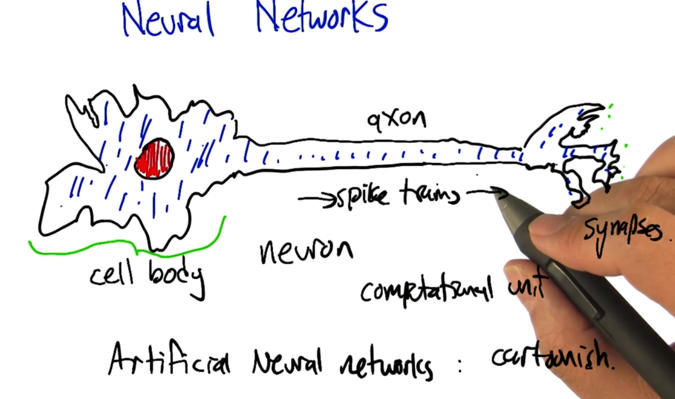
- A neuron will get input if all the input reach the firing threshold, it will fire
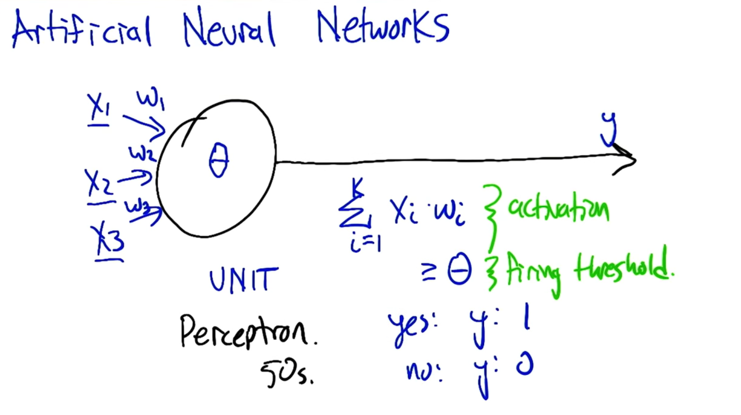
- X1,X2,… are inputs
- w1,w2,… are weights
- if the sum of all the weighted inputs is activation, if it passes a threshold θ, the output y=1; if not, y=0.
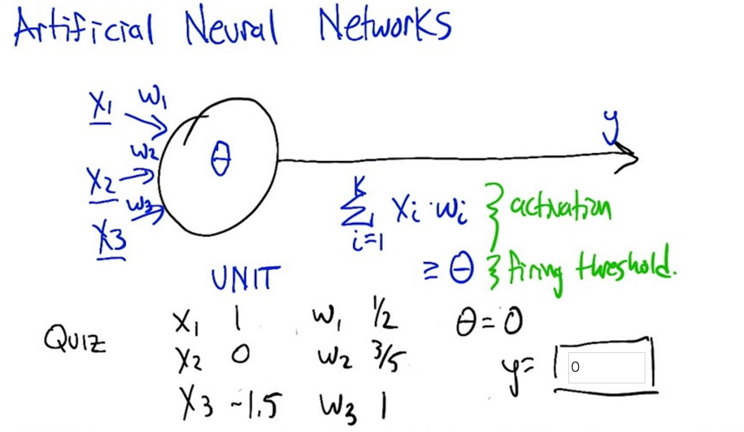
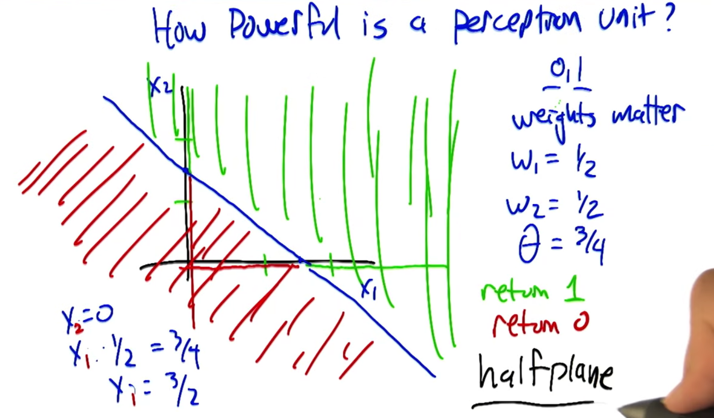
- weight matters a lot when deciding the line to split the plane.
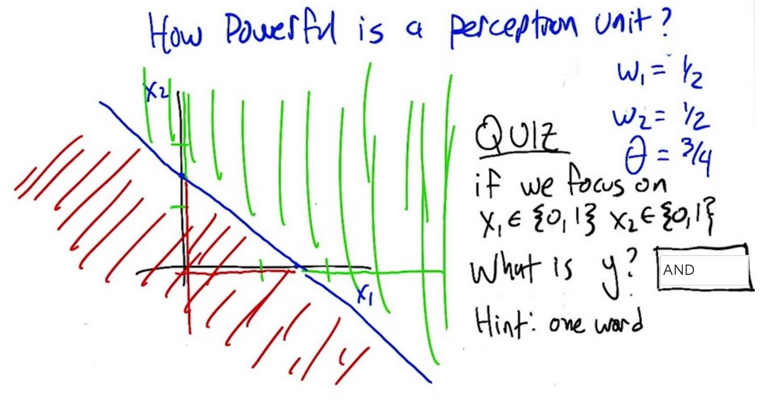
- When X1=0 and X2=0, y=0
- When X1=0 and X2=1, y=0
- When X1=1 and X2=0, y=0
- When X1=1 and X2=1, y=1; so y represents AND
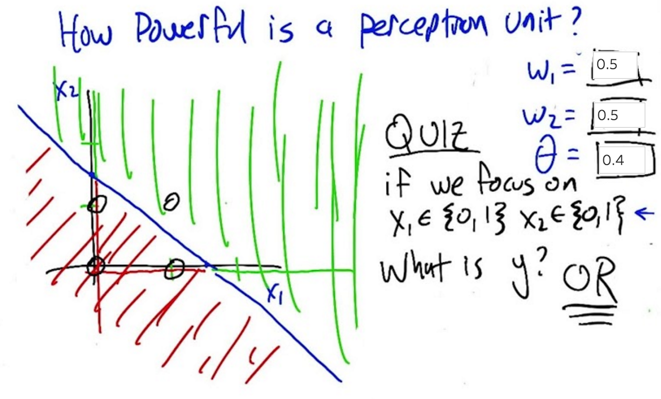
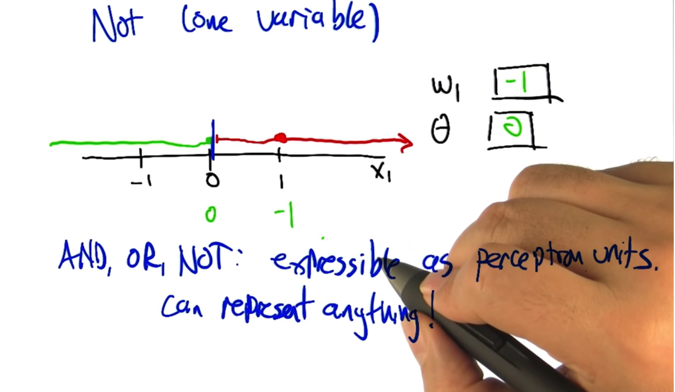
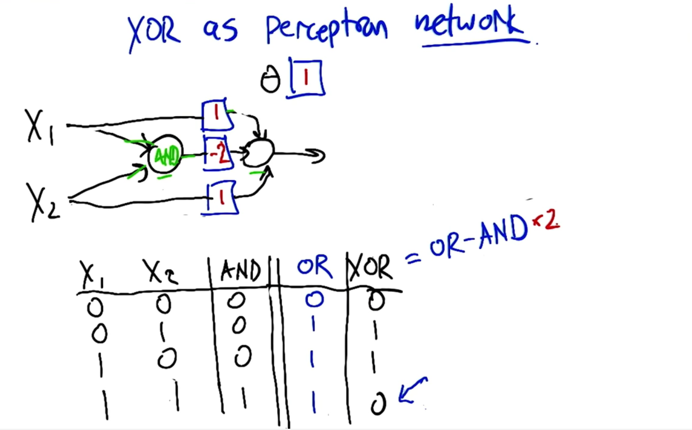
- XOR = OR - 2 * AND
Perceptron Training
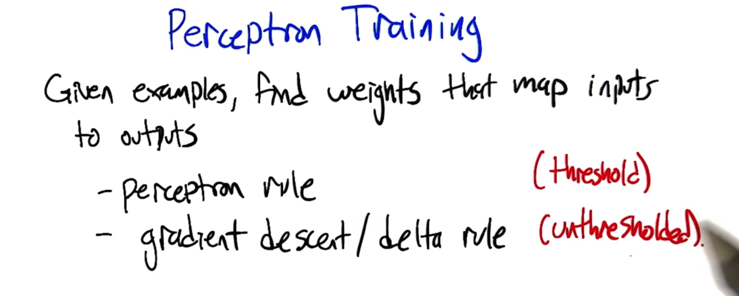
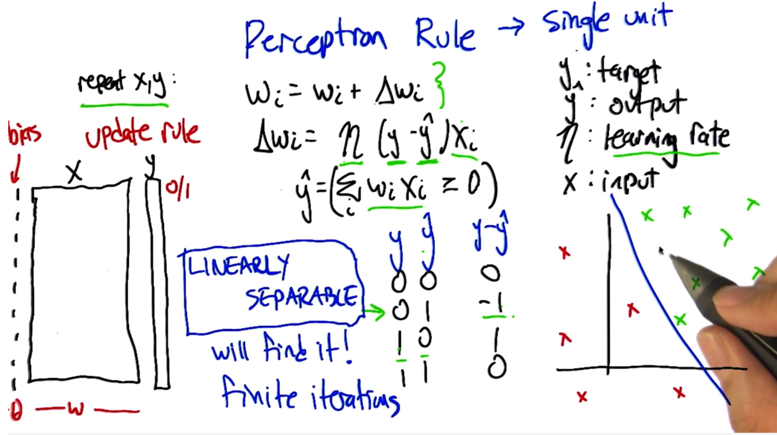
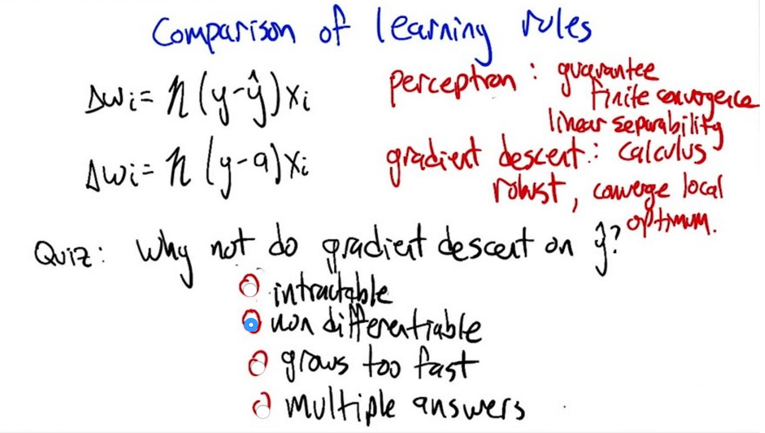
- the Perceptron Rule updates weight with weight_change ( Δwi). ( Δwi) is defined by the learning rate, the difference between target and output and input.
- if the data is linearly separable, Perceptron rule will find it, in finite iterations ( but it’s hard to know how many iterations are needed)
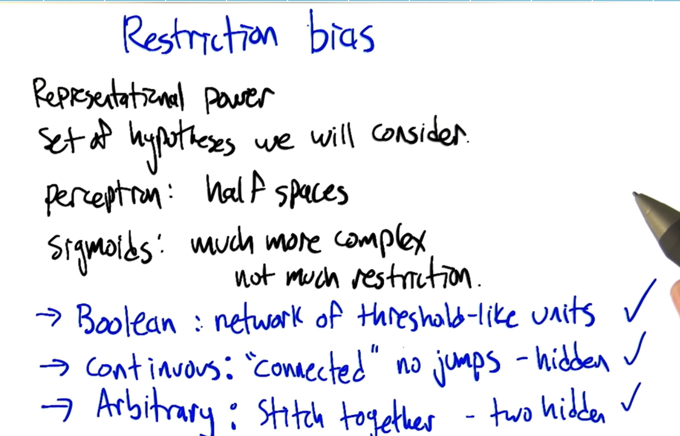
Preference Bias
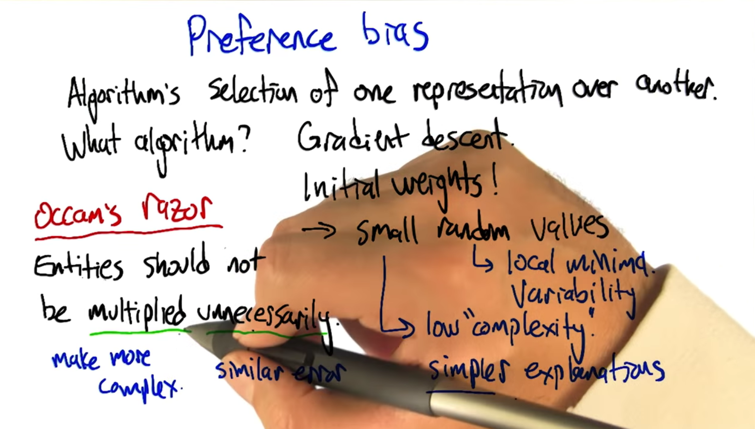
- Preference bias tells you something about the algorithm that you are using to learn.
- Prefer simpler explanations
- do not multiply unnecessarily ( not fitting the data).
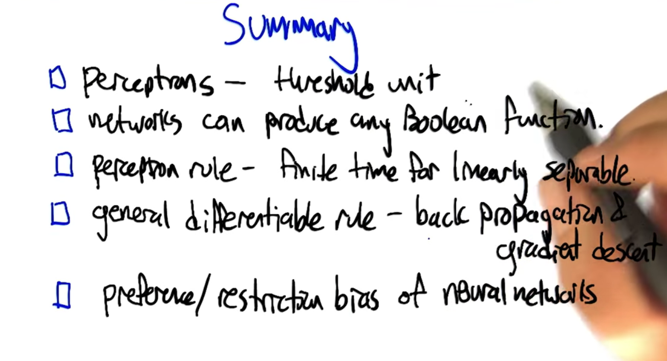
Summary
这些内容本该是Jan 11 – 17, 2016之间完成的,但是因为准备面试,拖到了一周之后。于是不得不一周补两周的内容。现在去看本周内容了……下次不要拖了,一拖就压力陡增啊。
2016-01-21 看到 Cross Validation in SL2
2016-01-22 继续SL3,初稿完成。