我是这样度过每一天
----向死而生-----
ML4T笔记 | 03-04 Ensemble learners, bagging and boosting
01 - Overview

-
1988, Michael Kearns and Leslie Valiant: Can a set of weak learners be combined to create a single, strong learner?
-
2006, Netflix: $1 million prize for a machine learning algorithm that could do 10% better than their own algorithm at predicting movies people like.
-
2009, The winning algorithm: a combination of several algorithm, or an ensemble learners.
Time: 00:00:42
-
-
ML4T笔记 | 03-03 Assessing a learning algorithm
01 - Overview

In this lesson, we’ll learn methods for assessing those algorithms.
Time: 00:00:25
02 - A closer look at KNN solutions
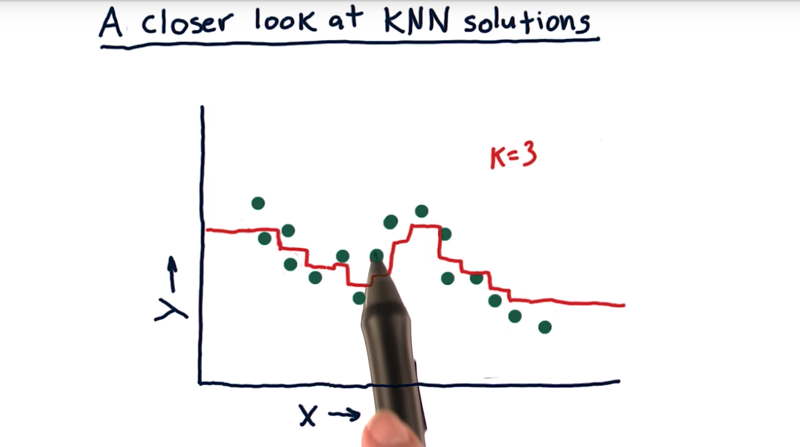
- If we query with X values using 3-NN, for example, as the X moves along the X-axis, the members of the KNN change, thus the resulted Y line (in red) will have small jumps.
- but the beginning and the end of the data, there are parts of the lines are flat (query gives the same value).
- Good thing: it’s not overfitting the data.
- Negative aspect: the model is not able to extrapolate when data is not available.
Time: 00:01:59
-
《You Can't Make Me》
人的性格,多种多样,有先天形成,或者后天的原因影响。 做父母的,如果遇到温顺体贴的孩子,大概会少生点儿气(当然并不一定少操心)。但是如果遇到了一...
-
折返点-1904---这一周都是夜跑
这一周,除了周日的时候是早上带女儿跑者去超市,其他的时候,都是夜跑。 夜跑的原因,是因为白天实在太懒的原因。 懒,是因为生病的原因...
-
请病假的这一天
昨天,听从妻的吩咐,请了一天的病假。 最近状态特别不好。周五开始生病,时而发烧,时而头疼,时而发冷。吃点儿药就退烧。过不多久又烧回来。周一的时候...
-
ML4T笔记 | 03-02 Regression
01 - Introduction

supervised regression learning or numerical model:
- using data to build a model that predicts a numerical output based on a set of numerical inputs.
Time: 00:00:23
02 - Parametric regression
Parametric regression is a way of building a model where we represent the model with the number of parameters. Example: build a model that will predict how much it will rain today based on changes in barometric pressure.
- if barometric pressure declines -> bad weather or rain.
- And when barometric pressure increases -> good weather coming.
-
新爸五年计划 084 “我生气啦”

每天总有这么一两次,儿子把脸色一沉,嘴里开始念叨“我生气啦”,“我生气啦”。那个“啦”字还要拉长音,再拐个弯儿。
这话,他是从姐姐那里学来的。姐姐是从我和妻那里学来的。
儿子还好办,他多数情况下,并不是遇到了什么真的让他难过生气的事情。如果真的有那样的事情发生,才一岁多的他,自然是咧开嘴大哭着找妈妈。
女儿则不同。她会用这句话来当作自己做错事情的借口。
你为什么打妈妈?- 我生气了!
你为什么大声喊叫? - 我生气了!
而真实的原因,多数时候是她想要奶吃,而妈妈犹豫了一下,要不要给。或者她要让爸爸陪她玩儿某个游戏,爸爸实在太累了,不愿意动弹。
-
ML4T笔记 | 03-01 How Machine Learning is used at a hedge fund
01 - Overview
- The focus is on creating a model that can be used to predict future prices for stocks or other assets.
- machine learning provides a suite of tools that support a data-centric way to build predictive models.
Time: 00:00:29
02 - The ML problem
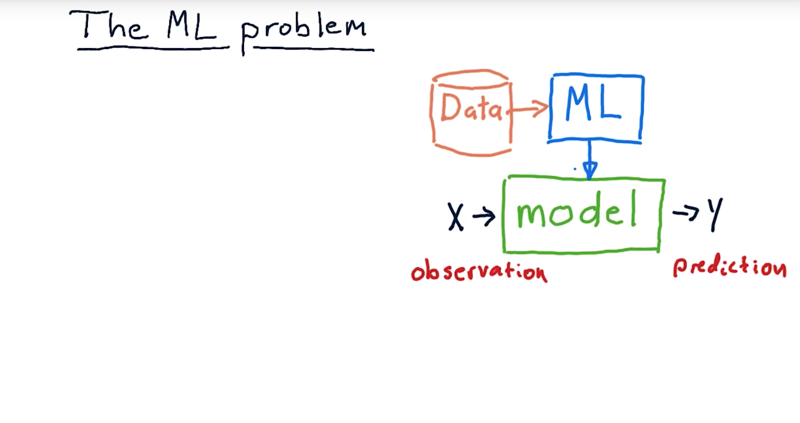
The problem the machine learning solves.
- building a model.
- A model is something that takes in observations like this x here, run it through some sort of process, and provide a y (prediction).
- X can be multidimensional (e.g. Bollinger Bands, PE ratio, and so on).
- Y is typically single-dimension represents the prediction.
-
ML4T笔记 | 01-09 Optimizers: How to optimize a portfolio
1 - What is portfolio optimization

- Your final project in this mini-course is to create a portfolio optimizer.
- portfolio optimization: Given a set of assets and a time period, find an allocation of funds to assets that maximize performance.
- performance can be measured by a number of metrics, including cumulative return, volatility or risk, and risk-adjusted return, which is Sharpe ratio.
Time: 00:00:52
-
零收件箱原则
如果你对GTD(Getting Things Done)有所耳闻,则你很可能听说过 “零收件箱原则”. 零收件箱原则,是整理电子邮件的原则。目的...